

January 2026 report archive. The original article summarized December 2025 and the full 2025 year. Its two stored graphics instead label their comparison columns November 2024 and November 2025. Both are preserved below, with the periods separated so readers can distinguish the original narrative from what the images actually show. The original report remains available for reference.
The following are the historical figures stated in the January article. The November graphics below do not independently verify these December results or full-year totals.
The article gave a 26.92% sales ratio, classified as a seller’s market under the report framework, a 97.57% sold-to-list figure, a $900,000 luxury threshold and a $1,350,000 median sale price. Named high-median markets were Pitkin County ($9.5 million), Whistler ($8.94 million), Paradise Valley ($5.2 million) and Naples ($4.5 million).
The article gave a 19.67% sales ratio, classified as balanced, a 97.88% sold-to-list figure, a $700,000 threshold and an $886,848 median sale price. Named high-median markets included Pitkin County ($4.2 million), Park City ($2.725 million), Fort Lauderdale ($2.725 million) and Telluride ($2.705 million). These are category-specific historical comparisons, not valuations of every home in those places.
The original narrative described sold-to-list figures as averages. Their December aggregation method is not established by the November graphics, which label their own SP/LP rows as medians. The article’s sales-ratio bands were buyer’s below 12%, balanced from 12% to under 21%, and seller’s at 21% or above; they belong to this report’s framework.
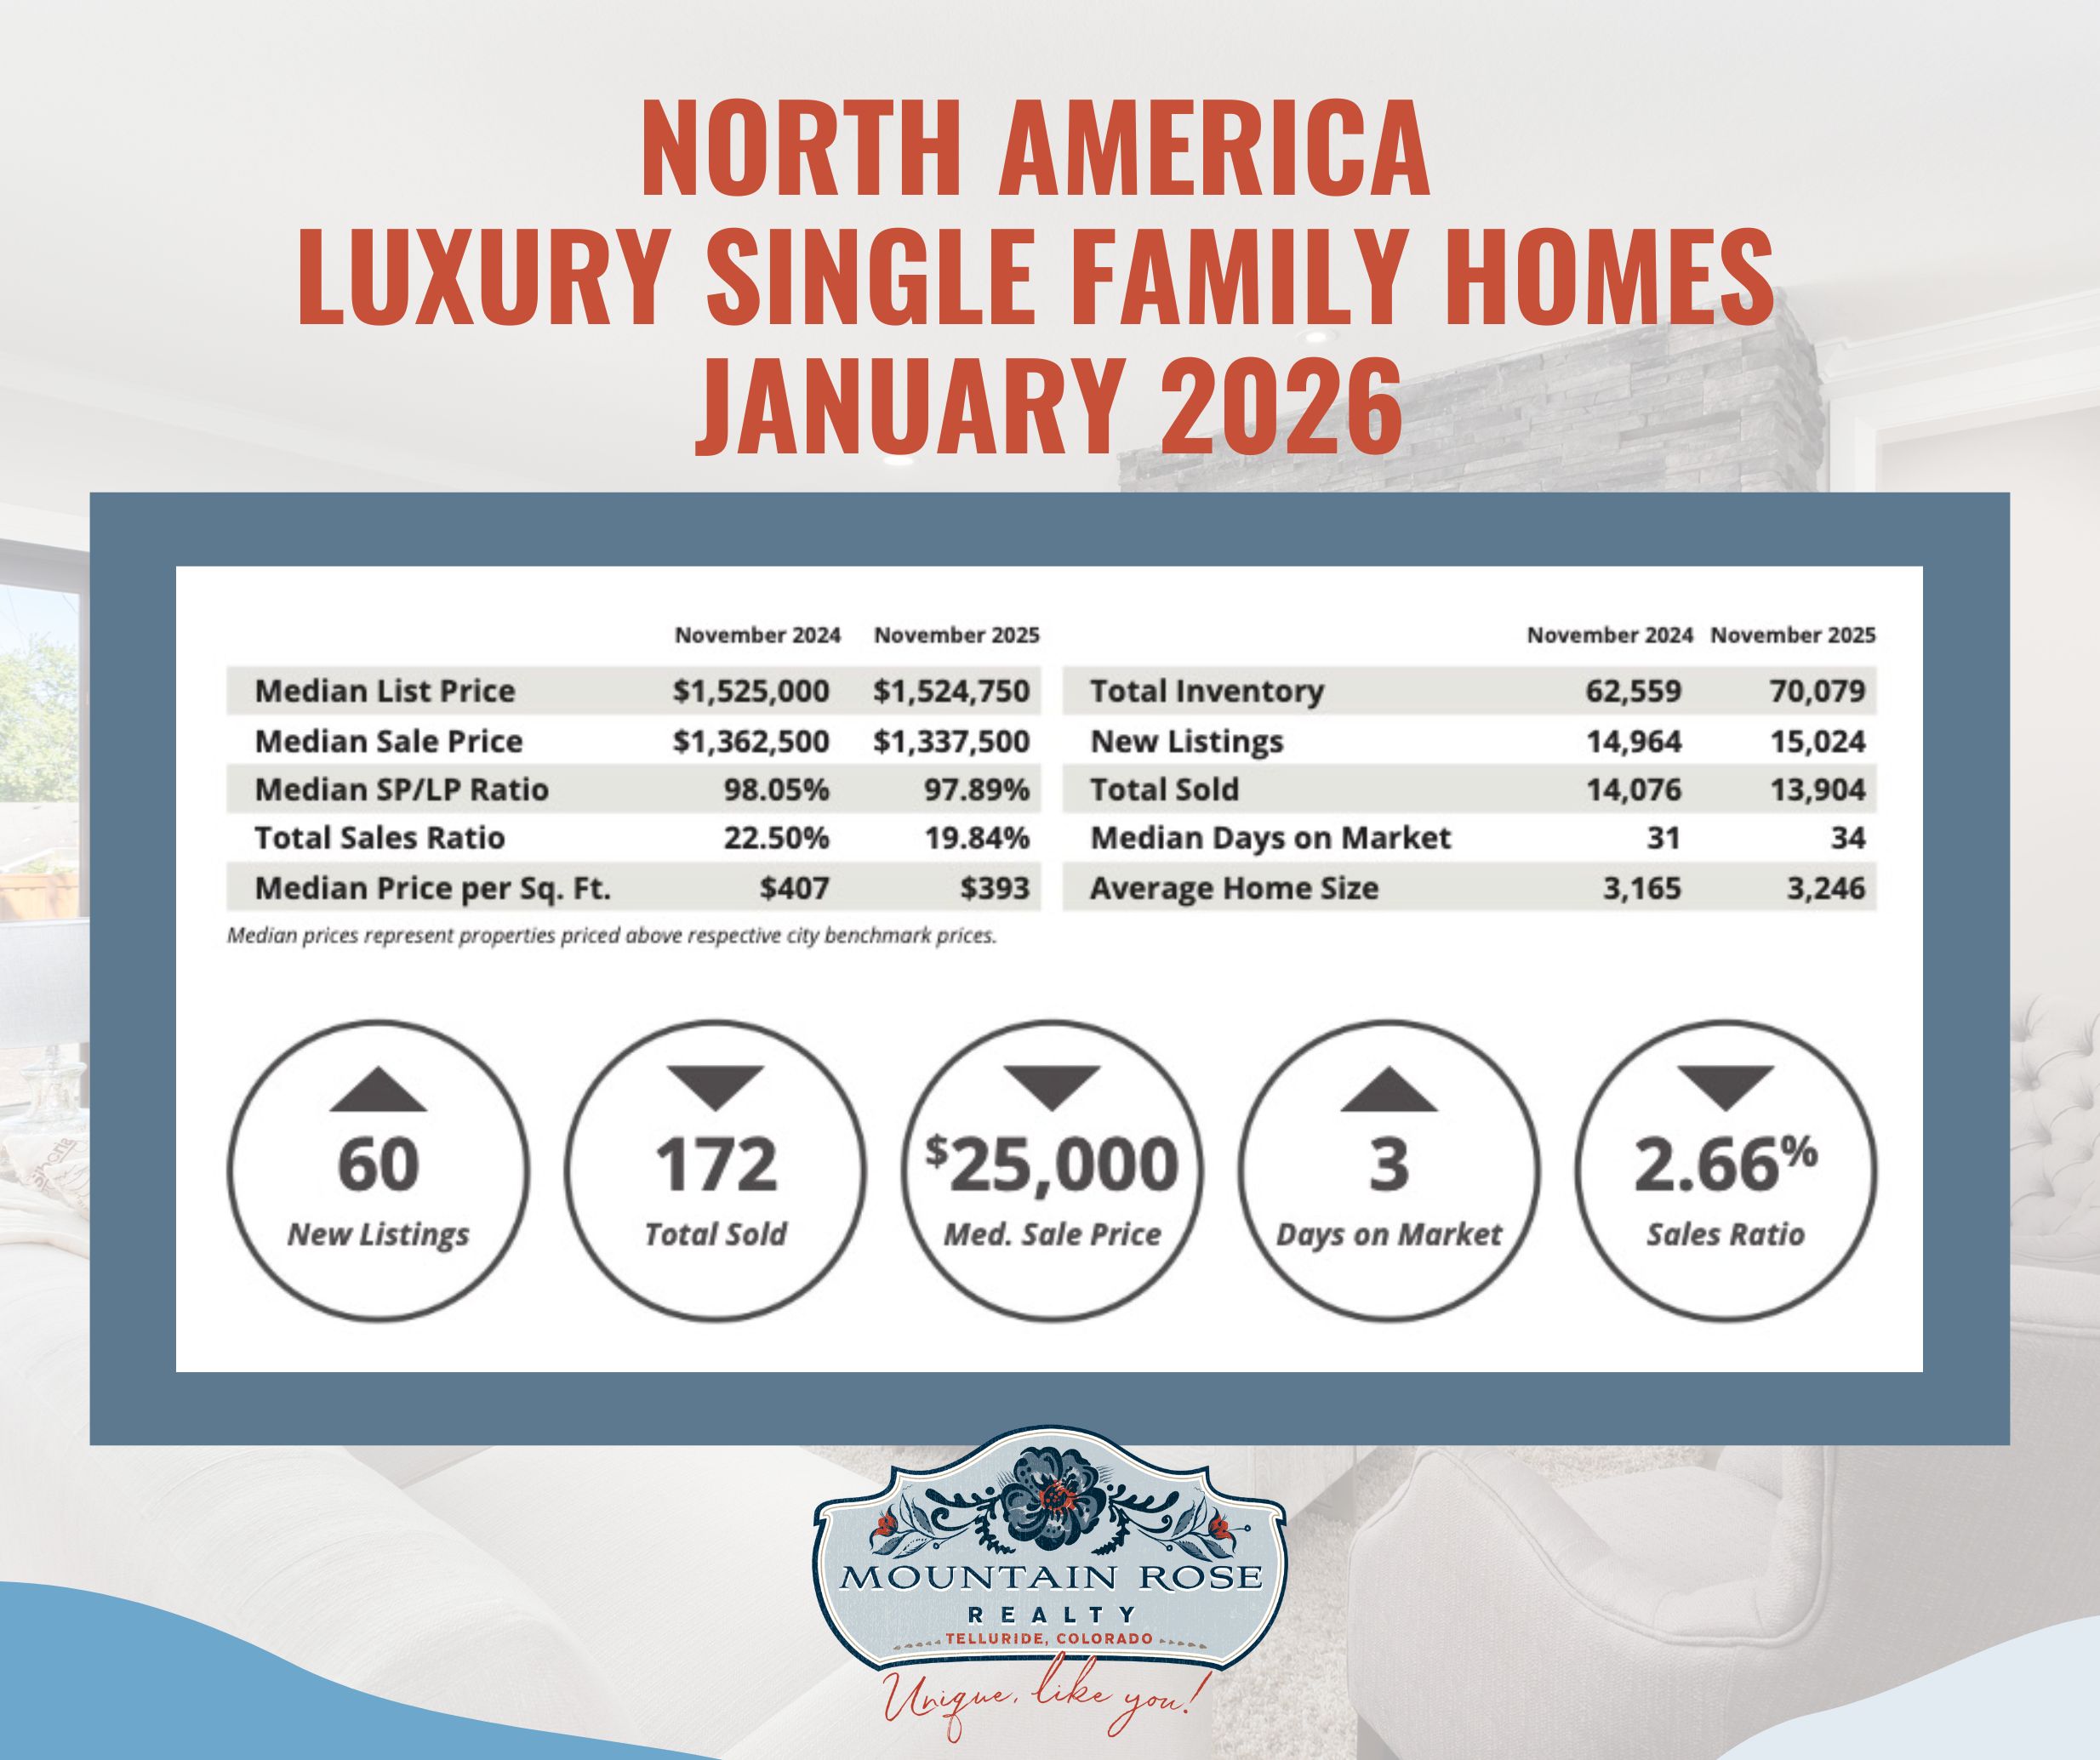
The image heading says January 2026, but its columns explicitly say November 2024 and November 2025. Median sale price changes from $1,362,500 to $1,337,500; total sold changes from 14,076 to 13,904; and the sales ratio changes from 22.50% to 19.84%. The sold count decreases by 172 even though its circular icon points upward. The table shows median days on market of 31 and 34, a three-day difference, while the circle prints four. Neither icon resolves these inconsistencies or converts the comparison into December data.
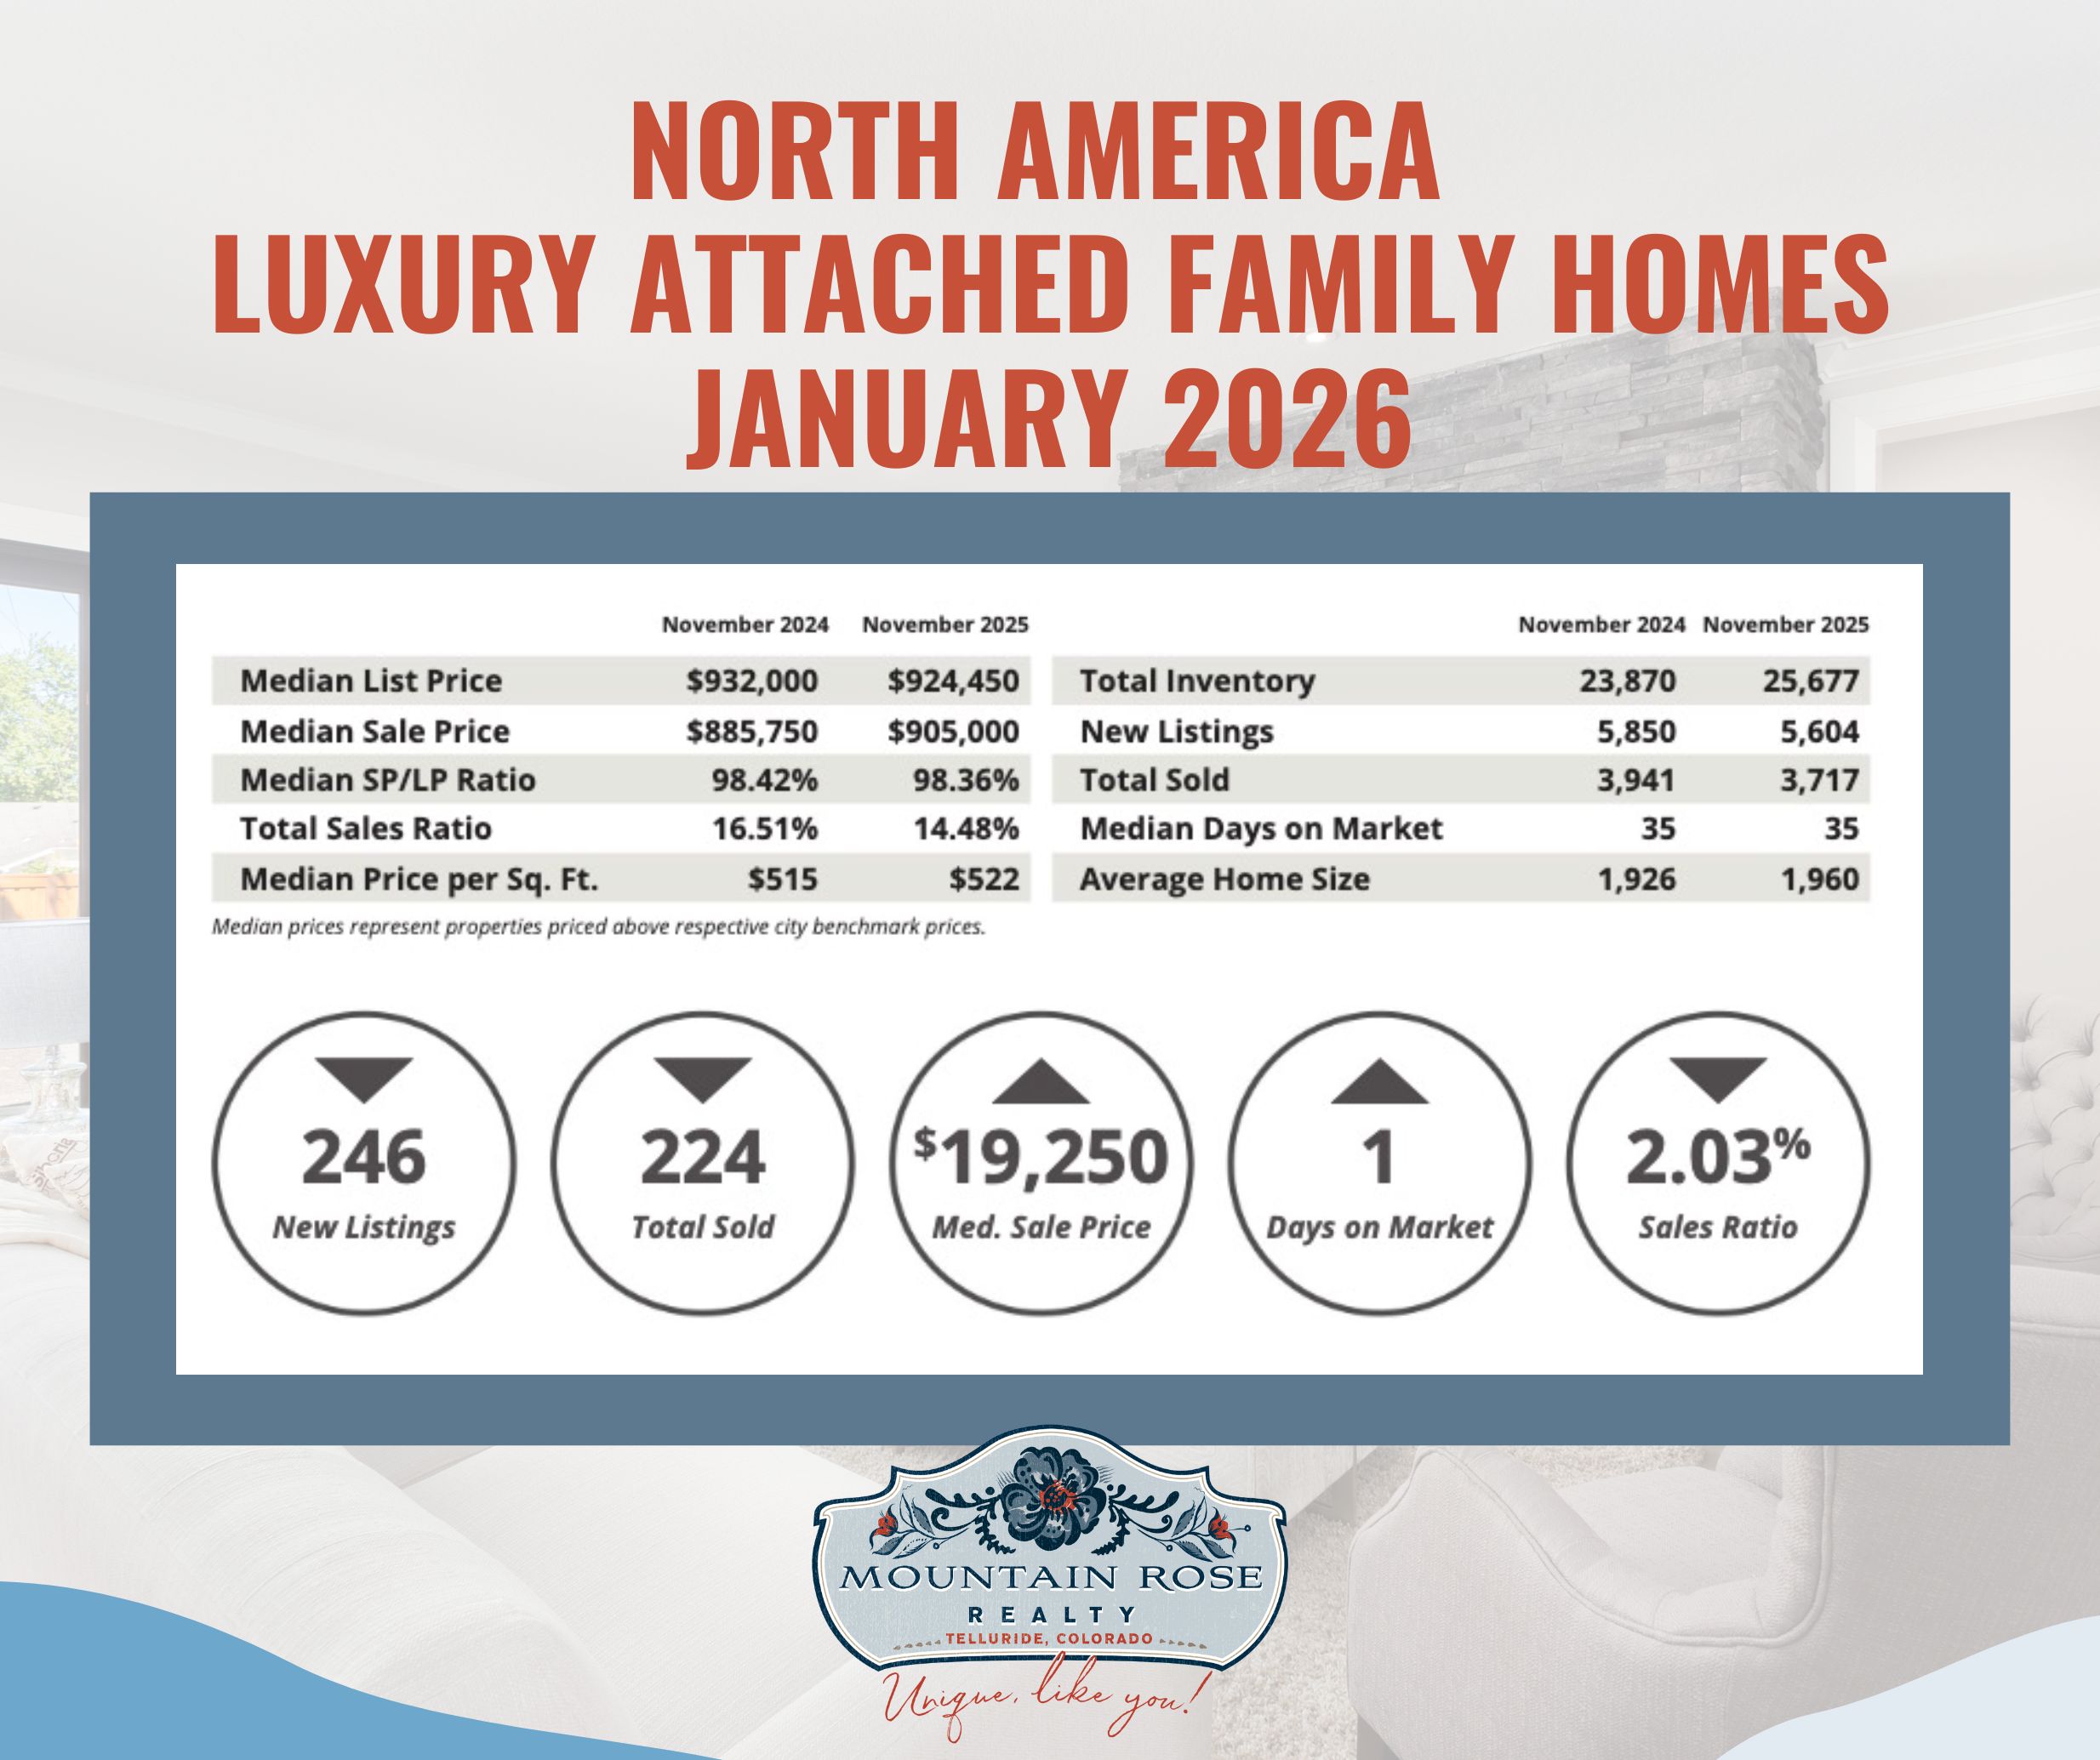
This companion image also labels its columns November 2024 and November 2025. Its values and definitions should be read within that period, separately from the December narrative above. A report-edition date does not change the dates printed in a source table.
The article discussed wellness spaces, sustainability and energy efficiency, smart-home operation, move-in readiness, presentation, pricing and sellers’ preferred timing or privacy. Those are useful property and service questions; the supplied numbers do not establish them as universal buyer preferences or as causes of price changes. Ask which features are actually present, what they cost to operate and maintain, and whether comparable buyers paid for similar features.
The original global discussion raised cross-border capital, geopolitical uncertainty, currency exposure, mobility, digital marketing and remote transactions. Those topics may matter to an individual purchase or sale, but the summary does not quantify their effect on Telluride demand. Carrying costs, exposure choices and financing should be evaluated for the particular owner and property rather than inferred from a regional median.
These figures concern the report’s selected luxury markets and price bands. A median can change because a different mix of homes sold; it does not measure appreciation of the same property. Report sales ratios are separate from sale-price-to-list-price ratios, and neither guarantees a particular home’s selling time or negotiation outcome. For a present Telluride inquiry, compare recent local transactions, active competition, property condition, location and contract terms. Contact Mountain Rose Realty to discuss that property-specific evidence.