

April 2025 article archive. This article’s original narrative discusses March 2025. Its two stored graphics are headed May 2025 and compare April 2024 with April 2025. The second is specifically a Telluride attached-home graphic. The period and geography differences are made explicit below; the images do not verify the March North America narrative. The original linked report is retained.
For North America single-family luxury homes, the original article reported sales up 7.3% year-over-year and nearly 40% month-over-month, inventory up 30.1% from March 2024, and new listings up 33.8%. It gave a $1,297,375 median sale price, a 98.79% sold-to-list figure and a 23.43% sales ratio, classified by the report as a seller’s market.
For attached luxury homes, it reported sales down 4.7% year-over-year but up 26.5% month-over-month; inventory up 28.4% year-over-year; and new listings up 25.7%. The reported median sale price was $922,500, the sold-to-list figure 98.95%, and the sales ratio 17.48%, classified as balanced. The original prose described the sold-to-list figures as averages; their March aggregation cannot be confirmed from the different April tables preserved here.
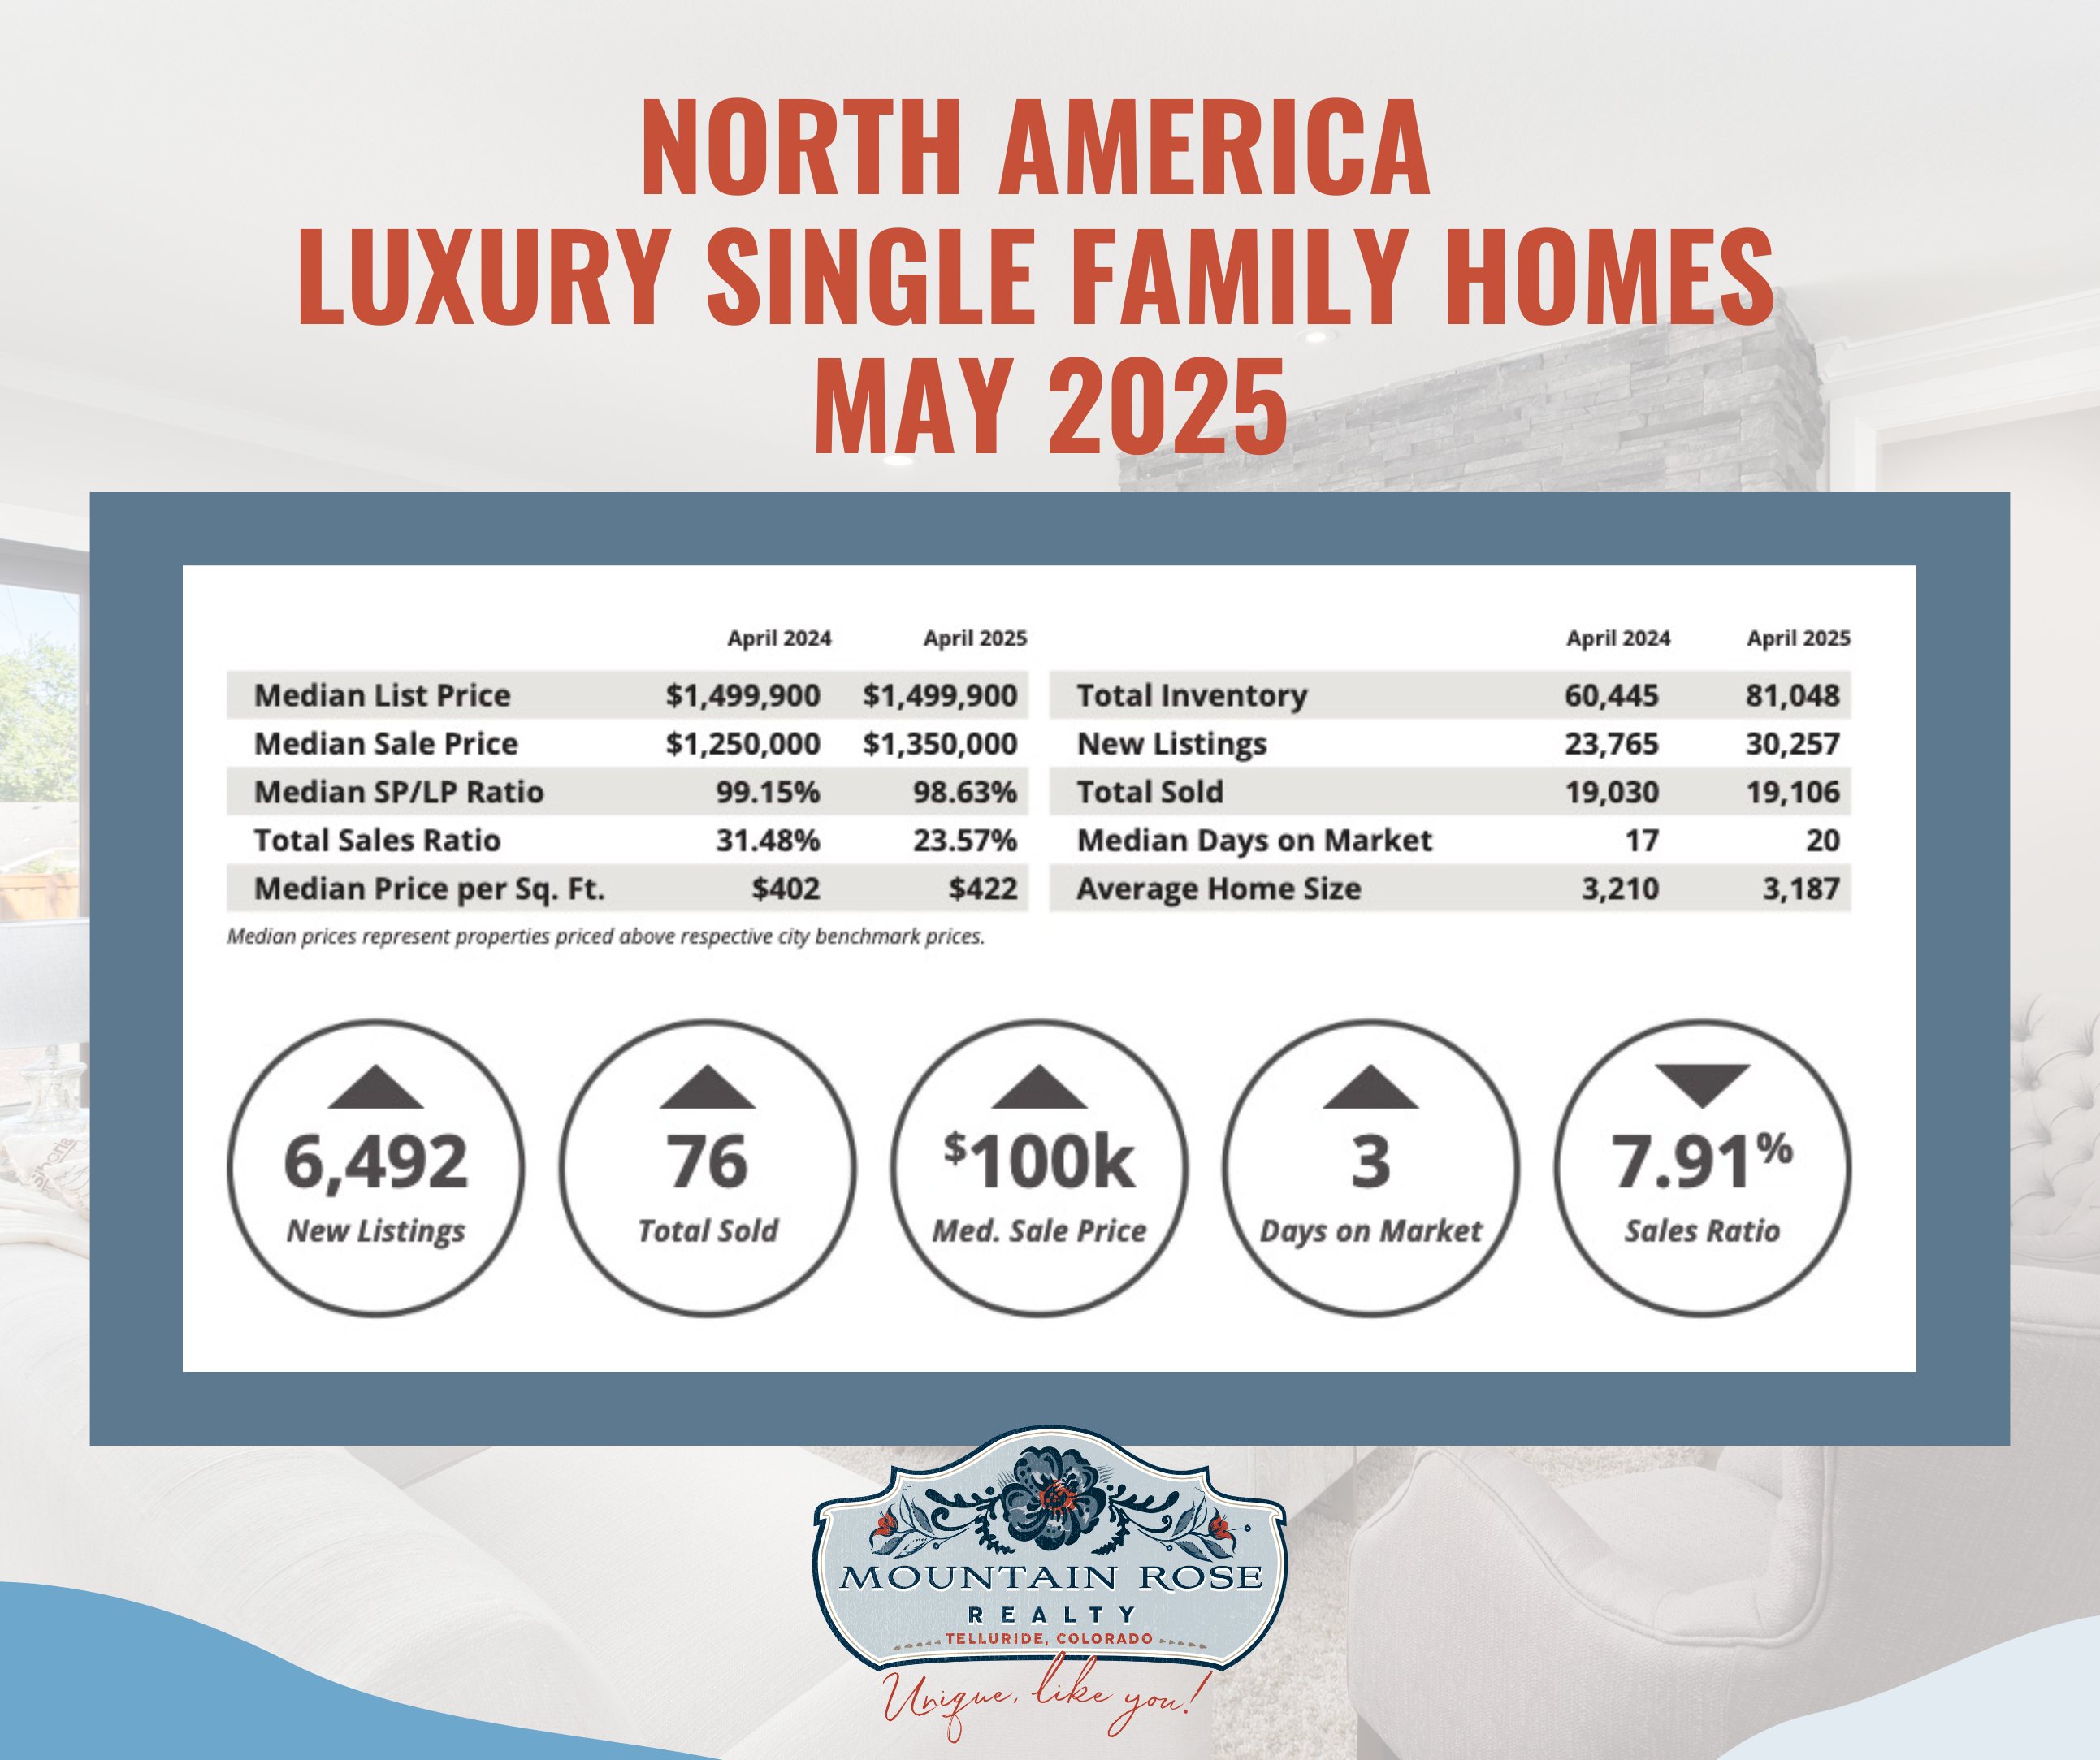
The May 2025 graphic explicitly compares April 2024 with April 2025. It prints median sale prices of $1,250,000 and $1,350,000; inventory of 60,445 and 81,048; new listings of 23,765 and 30,257; and total sold of 19,030 and 19,106. Its sales ratios are 31.48% and 23.57%; its median SP/LP ratios are 99.15% and 98.63%. These figures belong to April and should not be substituted for the March claims above.
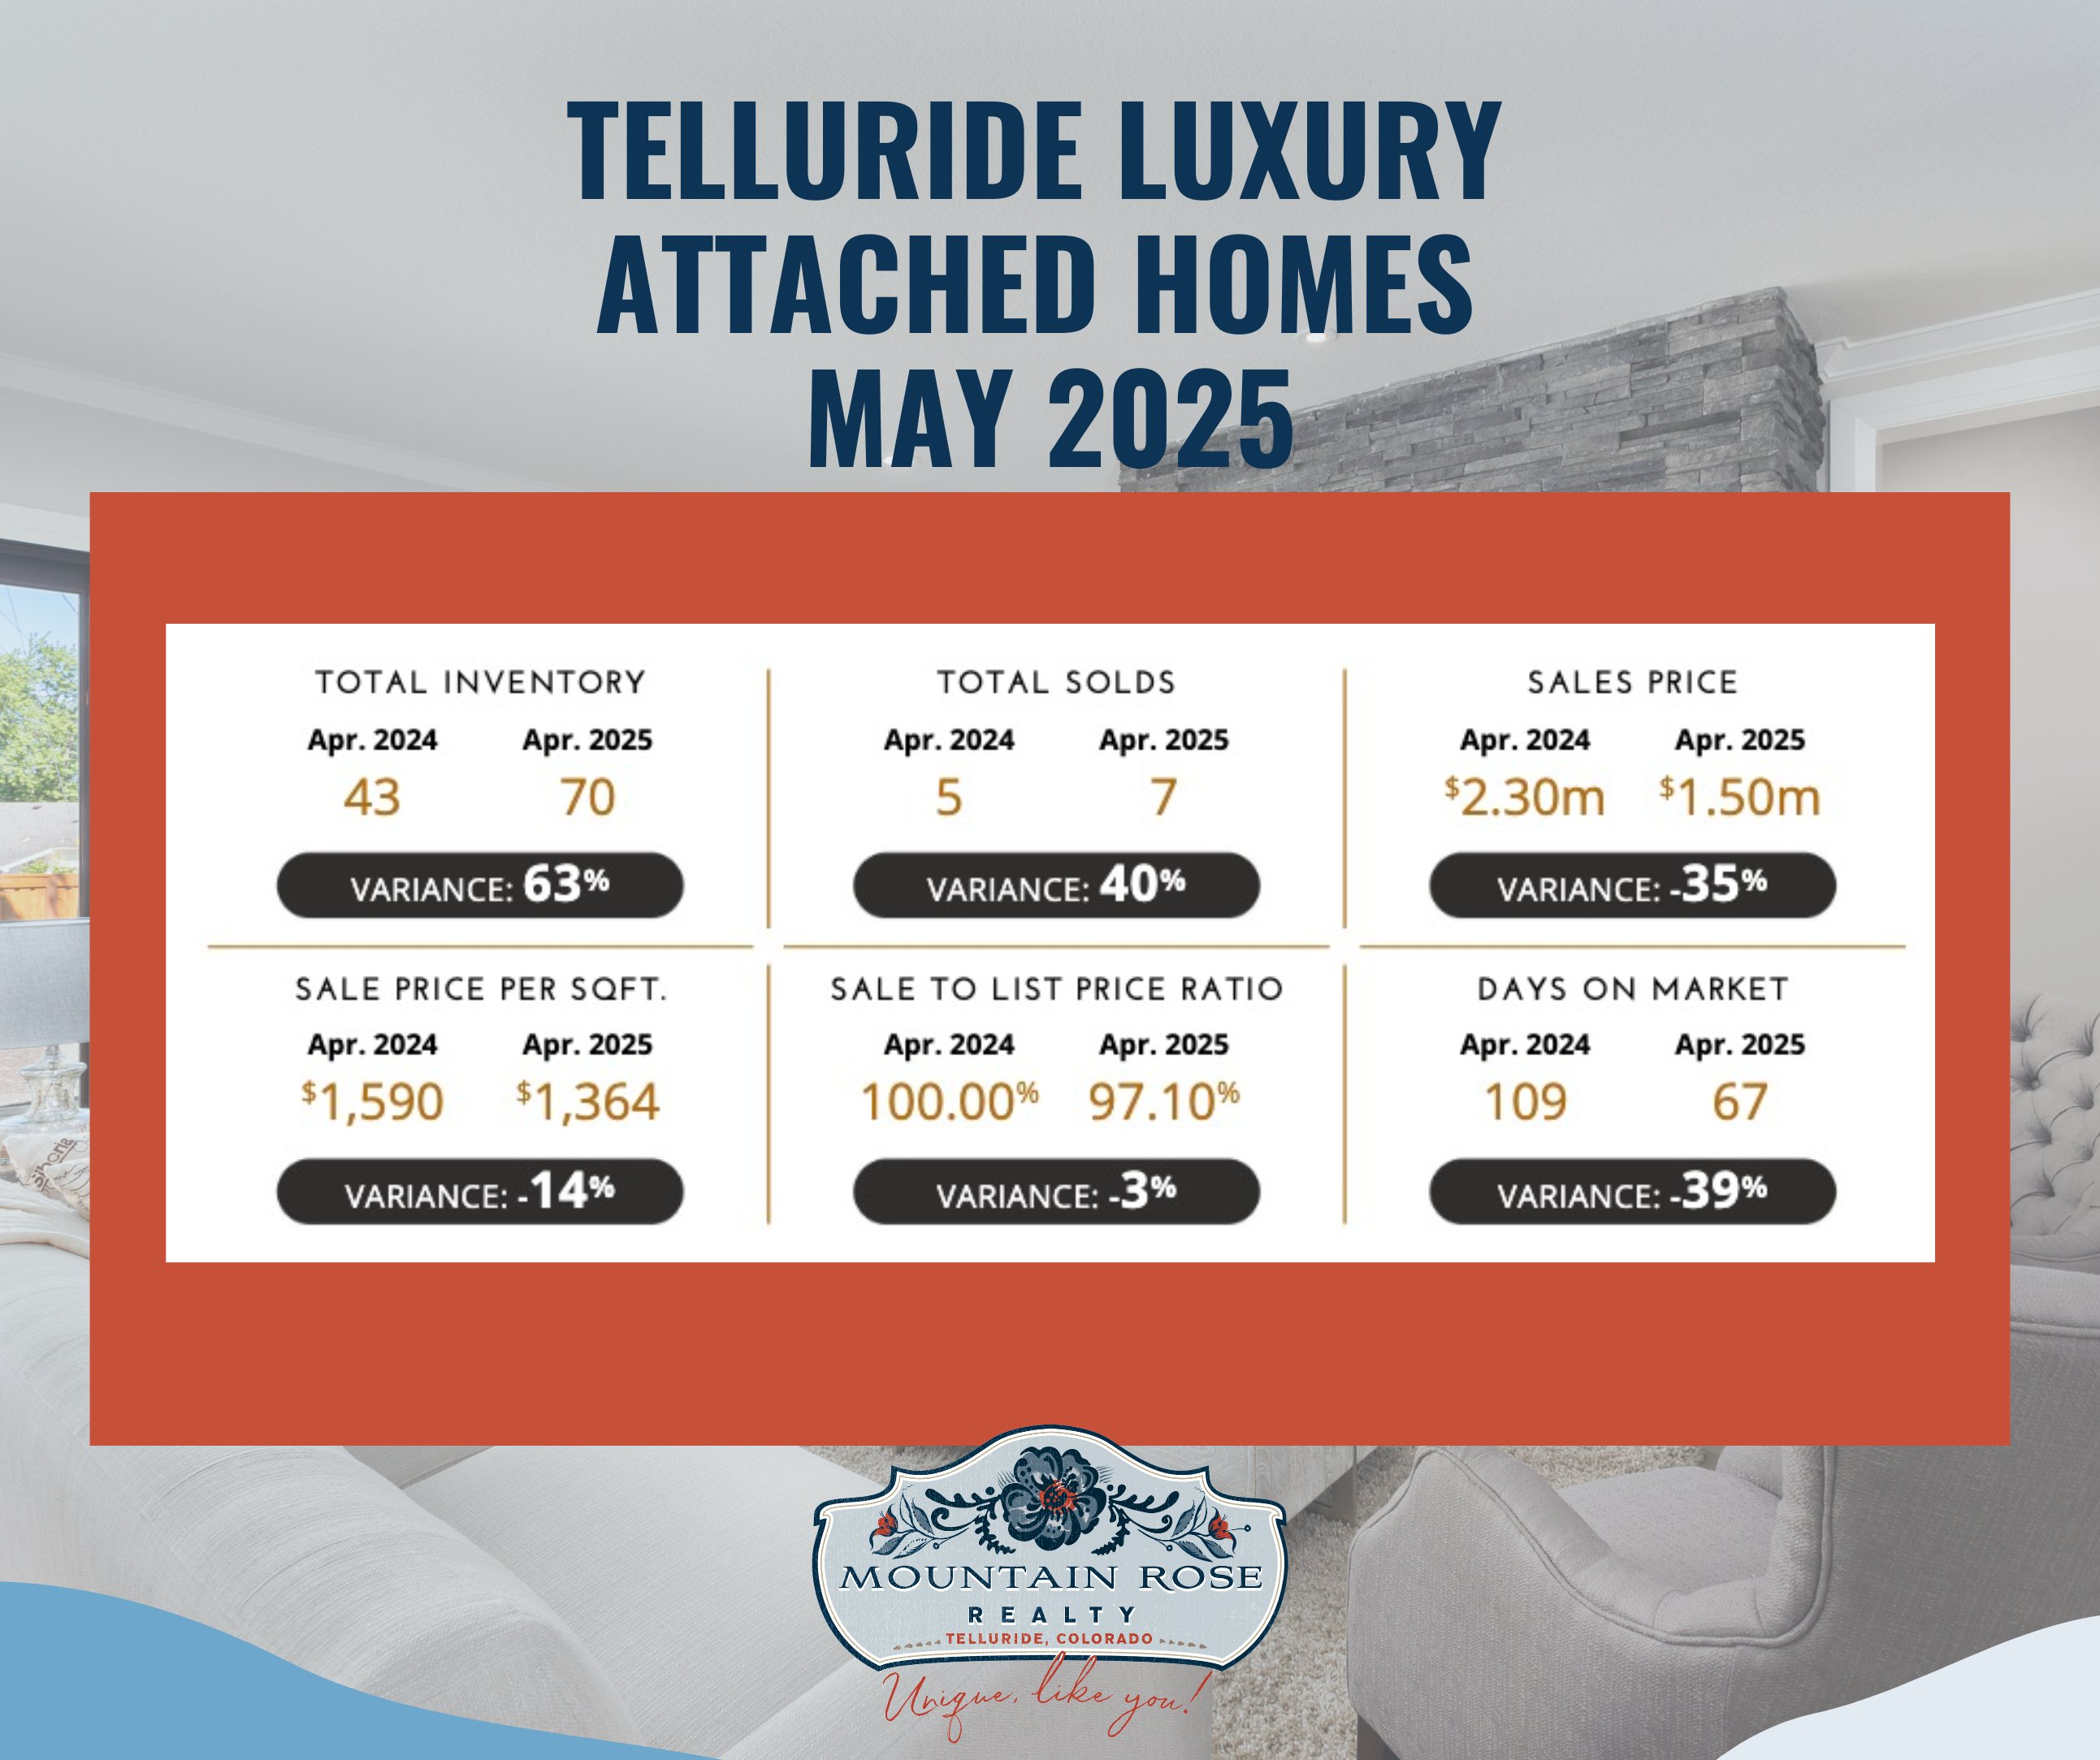
This is a Telluride graphic, not a North America attached-home aggregate. It reports April 2024 and April 2025 inventory of 43 and 70, and sold counts of 5 and 7. Its literal “Sales Price” fields are $2.30 million and $1.50 million; that label alone does not establish whether the statistic is a median or a mean. Sale price per square foot is $1,590 and $1,364; SP/LP is 100% and 97.10%; and days on market are 109 and 67.
The graphic prints rounded variances of 63% for inventory, 40% for sold count, −35% for sales price, −14% for price per square foot, −3% for SP/LP and −39% for days on market. The small five-sale and seven-sale groups can differ in property mix. These figures do not show that every attached home lost 35% of its value.
The original commentary discussed mountain retreats, wellness amenities, multigenerational layouts, sustainable features, technology and customization. Those are useful preferences to discuss with an individual buyer. The summary does not supply demographic evidence proving that Millennials and Generation X drove these changes, or transaction evidence establishing buyers’ motives, confidence or investment security.
Interest-rate policy, stock-market changes, construction-material costs, insurance and foreign-investment rules were also identified as possible considerations. Evaluate the applicable jurisdiction, current financing, insurance availability and project costs for a particular transaction. The historical sales percentages do not establish which factor caused the results or forecast the next quarter.
These figures concern the report’s selected luxury markets and price bands. A median can change because a different mix of homes sold; it does not measure appreciation of the same property. Report sales ratios are separate from sale-price-to-list-price ratios, and neither guarantees a particular home’s selling time or negotiation outcome. For a present Telluride inquiry, compare recent local transactions, active competition, property condition, location and contract terms. Contact Mountain Rose Realty to discuss that property-specific evidence.