
March 2025 archive: This report presents February 2025 data. The report’s market labels and ratios describe its own source-period inventory and closed-sales methodology; they do not establish today’s conditions, an appraisal, or a transaction outcome.
The original 22-page report is retained here for its source context.
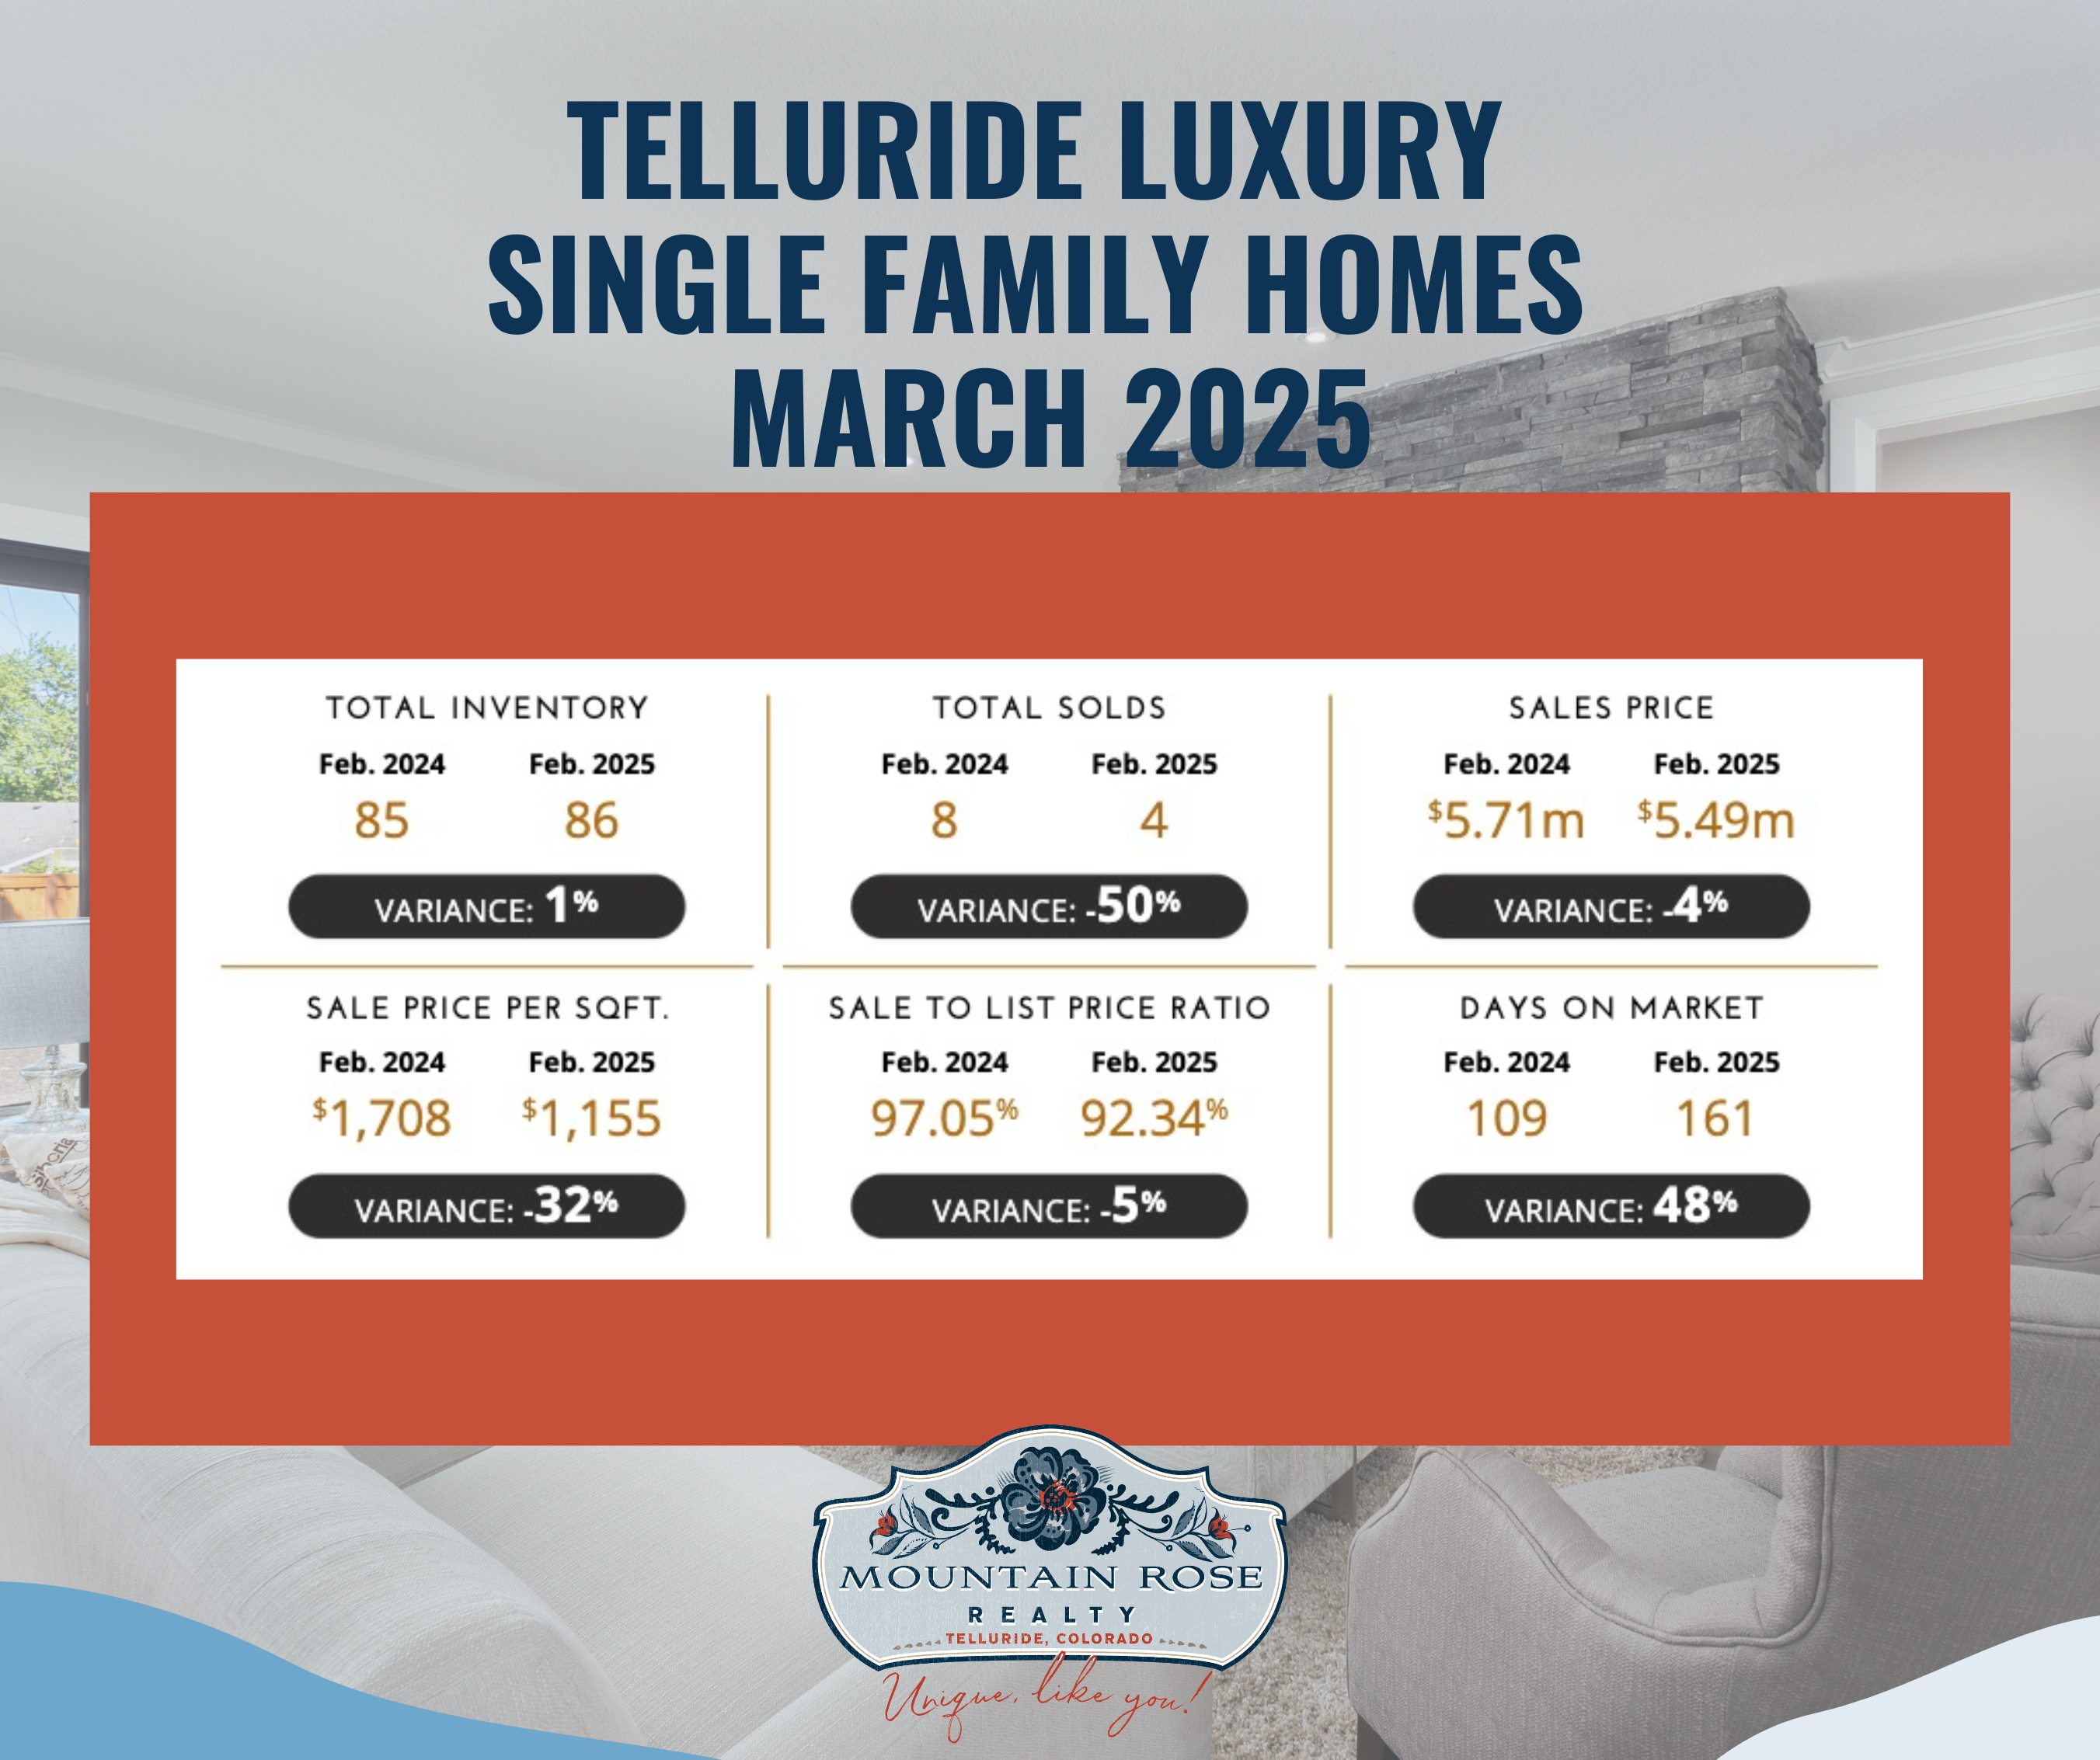
| Measure | February 2024 | February 2025 |
|---|---|---|
| Inventory | 85 | 86 |
| Sales | 8 | 4 |
| Median sale price | $5.71 million | $5.49 million |
| Median price per square foot | $1,708 | $1,155 |
| Median sale-to-list ratio | 97.05% | 92.34% |
| Median days on market | 109 | 161 |
The chart reports 86 inventory listings and 4 sales, a 5% sales ratio, a $5,492,500 median sale price, 161 median days on market versus 109 in February 2024, and a 92.34% median sale-to-list ratio. It identifies the $1,500,000 to $1,999,999 band as the most active at a 25% sales ratio. The report defines the luxury benchmark at $1.5 million and notes that its data includes active and sold properties, not pending properties.
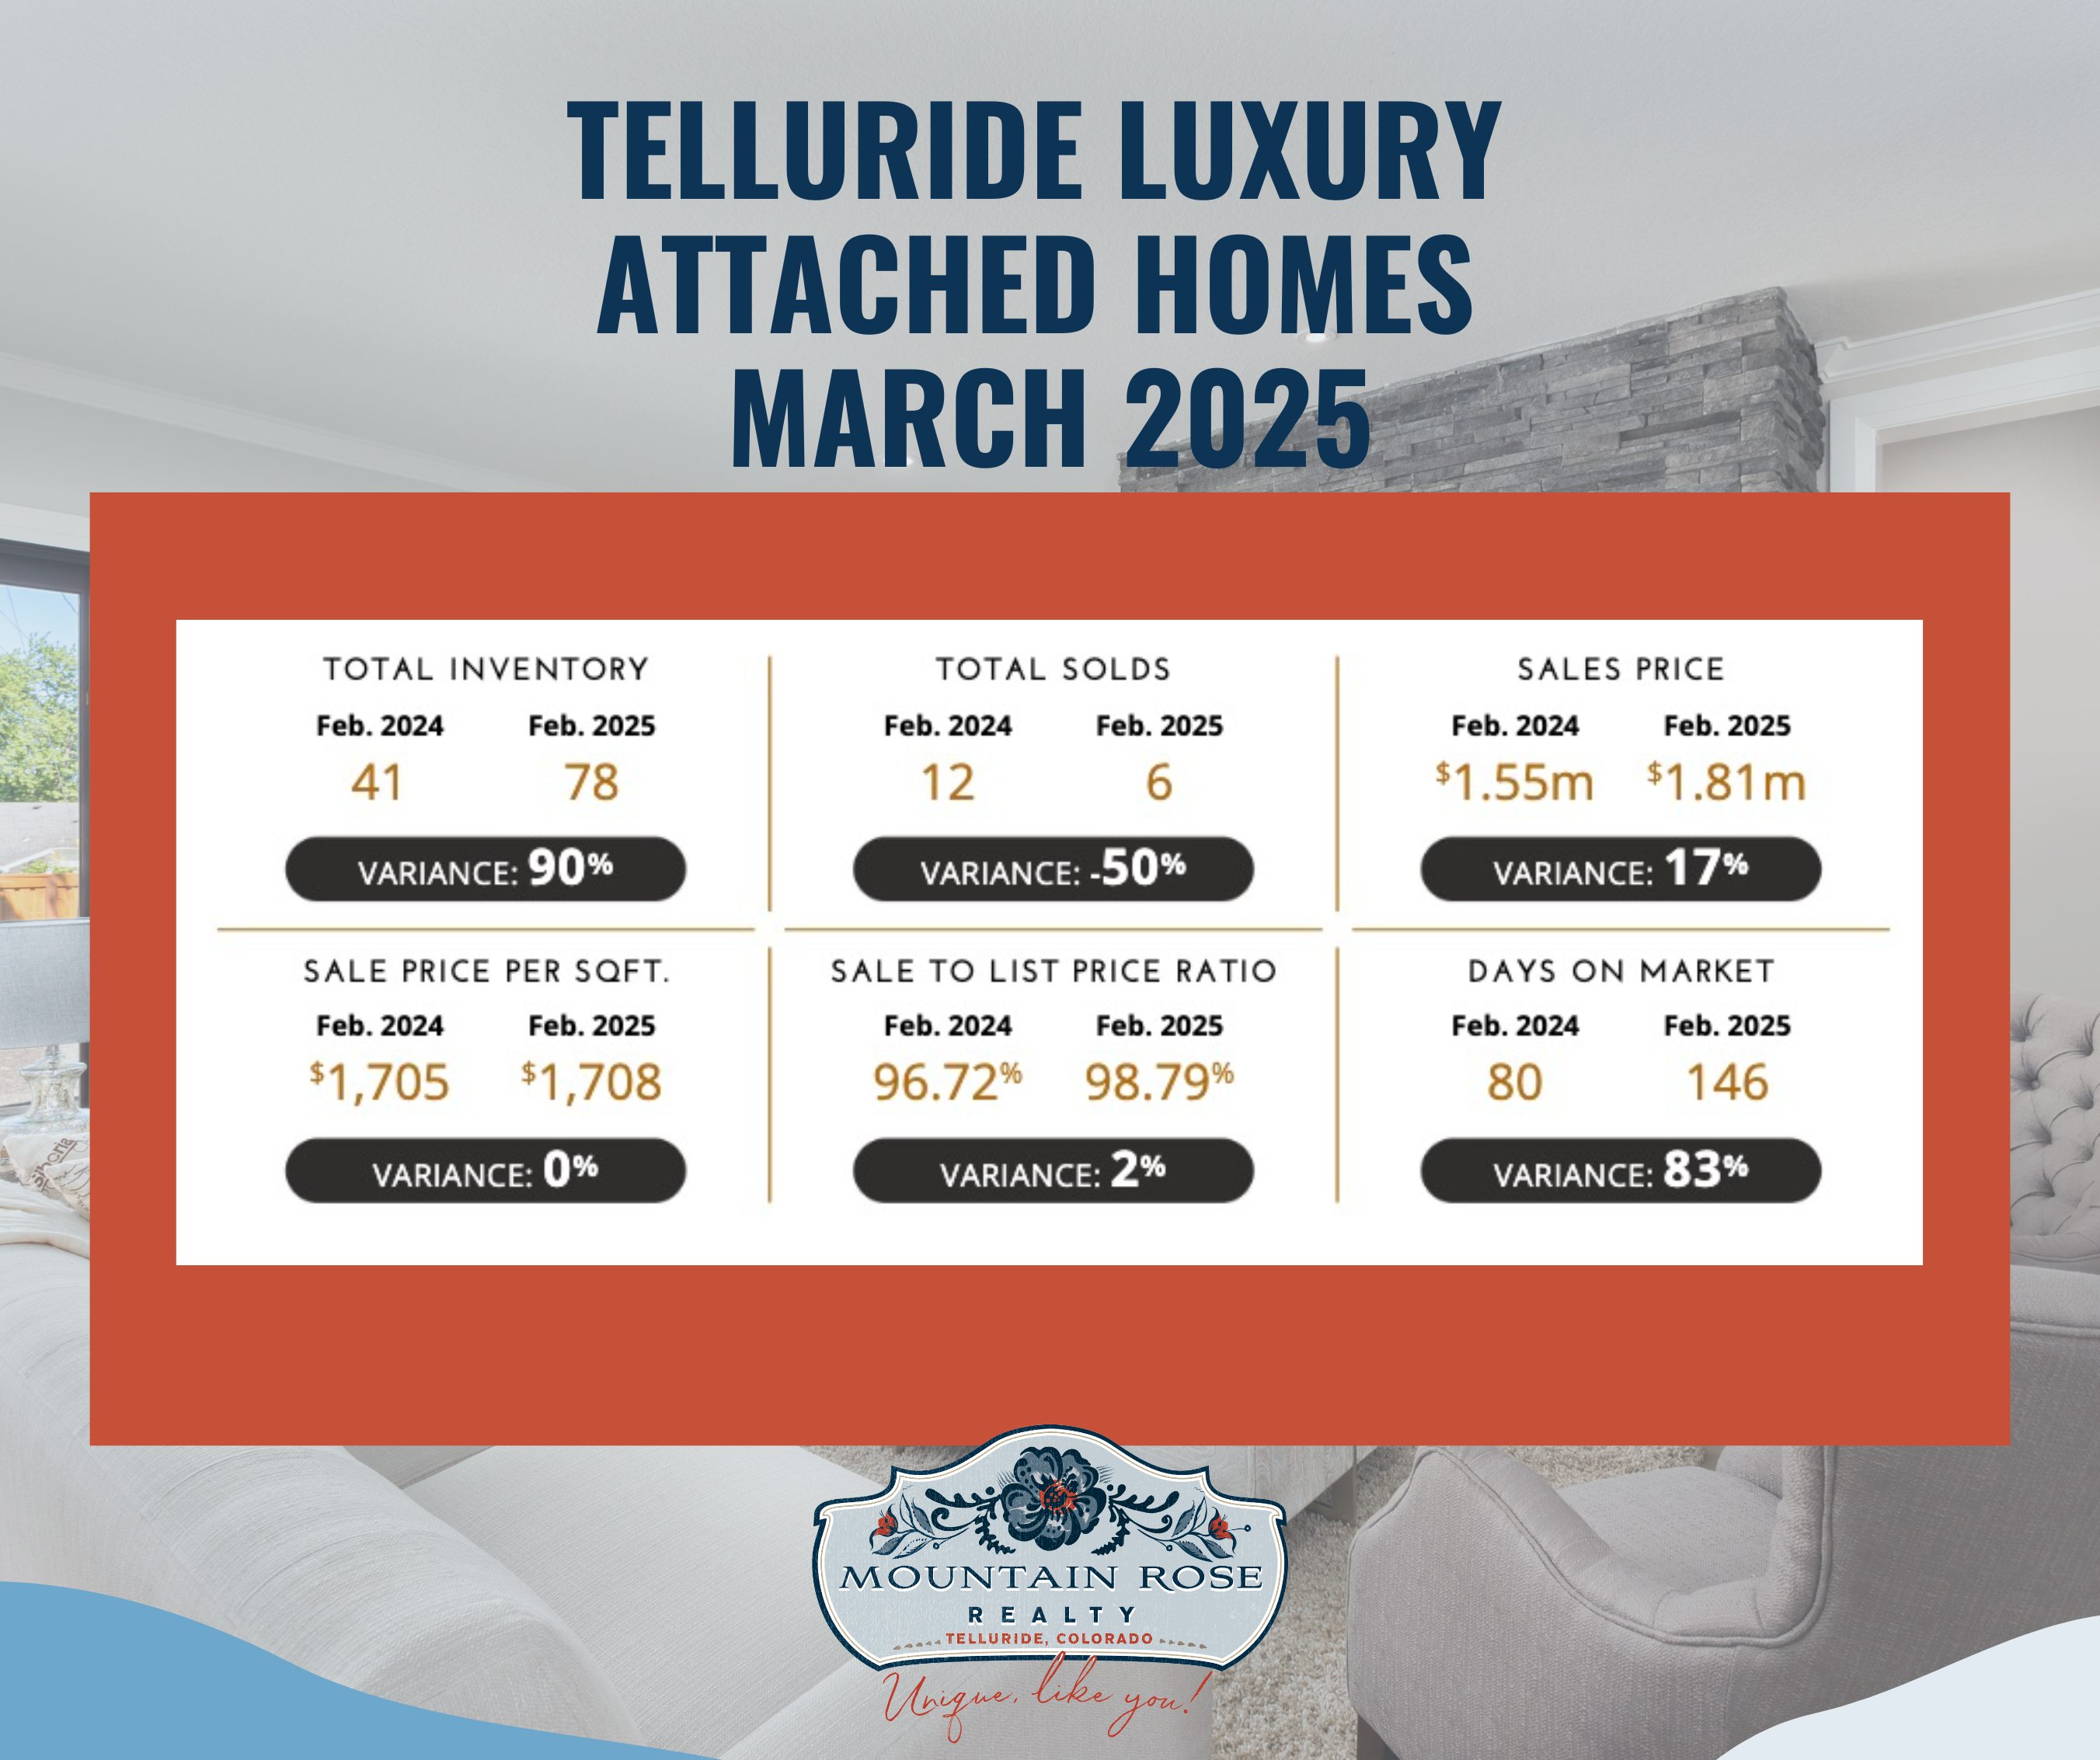
| Measure | February 2024 | February 2025 |
|---|---|---|
| Inventory | 41 | 78 |
| Sales | 12 | 6 |
| Median sale price | $1.55 million | $1.81 million |
| Median price per square foot | $1,705 | $1,708 |
| Median sale-to-list ratio | 96.72% | 98.79% |
| Median days on market | 80 | 146 |
For attached homes, the report shows 78 inventory listings and 6 sales, an 8% sales ratio, a $1,810,000 median sale price, 146 median days on market versus 80 in February 2024, and a 98.79% median sale-to-list ratio. The displayed $500,000 to $599,999 band has one sale and one active listing, producing its 100% sales ratio. That percentage is a ratio for the illustrated band, not a promise of price or speed.
The original article reported North American single-family sales increases of 4.4% year over year and 16.2% month over month, and attached sales increases of 2.3% and 18.7%, respectively. It also reported inventory increases of 24.2% for single-family and 27.8% for attached homes, and new-listing increases of 17.9% and 15.7%. These figures describe the publisher’s North American coverage, not Telluride.
The retained report’s North American single-family table supports the year-over-year comparison: February 2024 to February 2025 inventory rose from 50,040 to 62,170, new listings from 17,720 to 20,900, and sales from 11,337 to 11,839. Those totals produce approximately 24.2%, 17.9%, and 4.4% increases. The other percentage changes remain attributed to the original article; they have not been independently reconstructed here. The report’s discussion of Canada, the United States, demographics, regulation, and investment conditions is historical publisher commentary, not a current local forecast.
The tables retain the charts’ rounded million-dollar prices. The report gives the February 2025 single-family median more precisely as $5,492,500 and the February 2024 attached median as $1,545,000. Its luxury benchmarks are $1.5 million for single-family and $500,000 for attached homes. These report-defined segments should not be treated as all homes in Telluride or San Miguel County.
Use the report as a dated comparison point. For a current decision, compare like-for-like properties, current MLS inventory, closed sales, HOA and ownership terms, condition, financing, and transaction timing. Contact Mountain Rose Realty for a current property-specific discussion.