

Presented by Mountain Rose Realty and Anne-Britt Ostlund. This is a historical report edition covering November 2025, with November 2024 comparisons. Read the original luxury market report for its full market coverage and definitions. The edition month and the period measured are different.
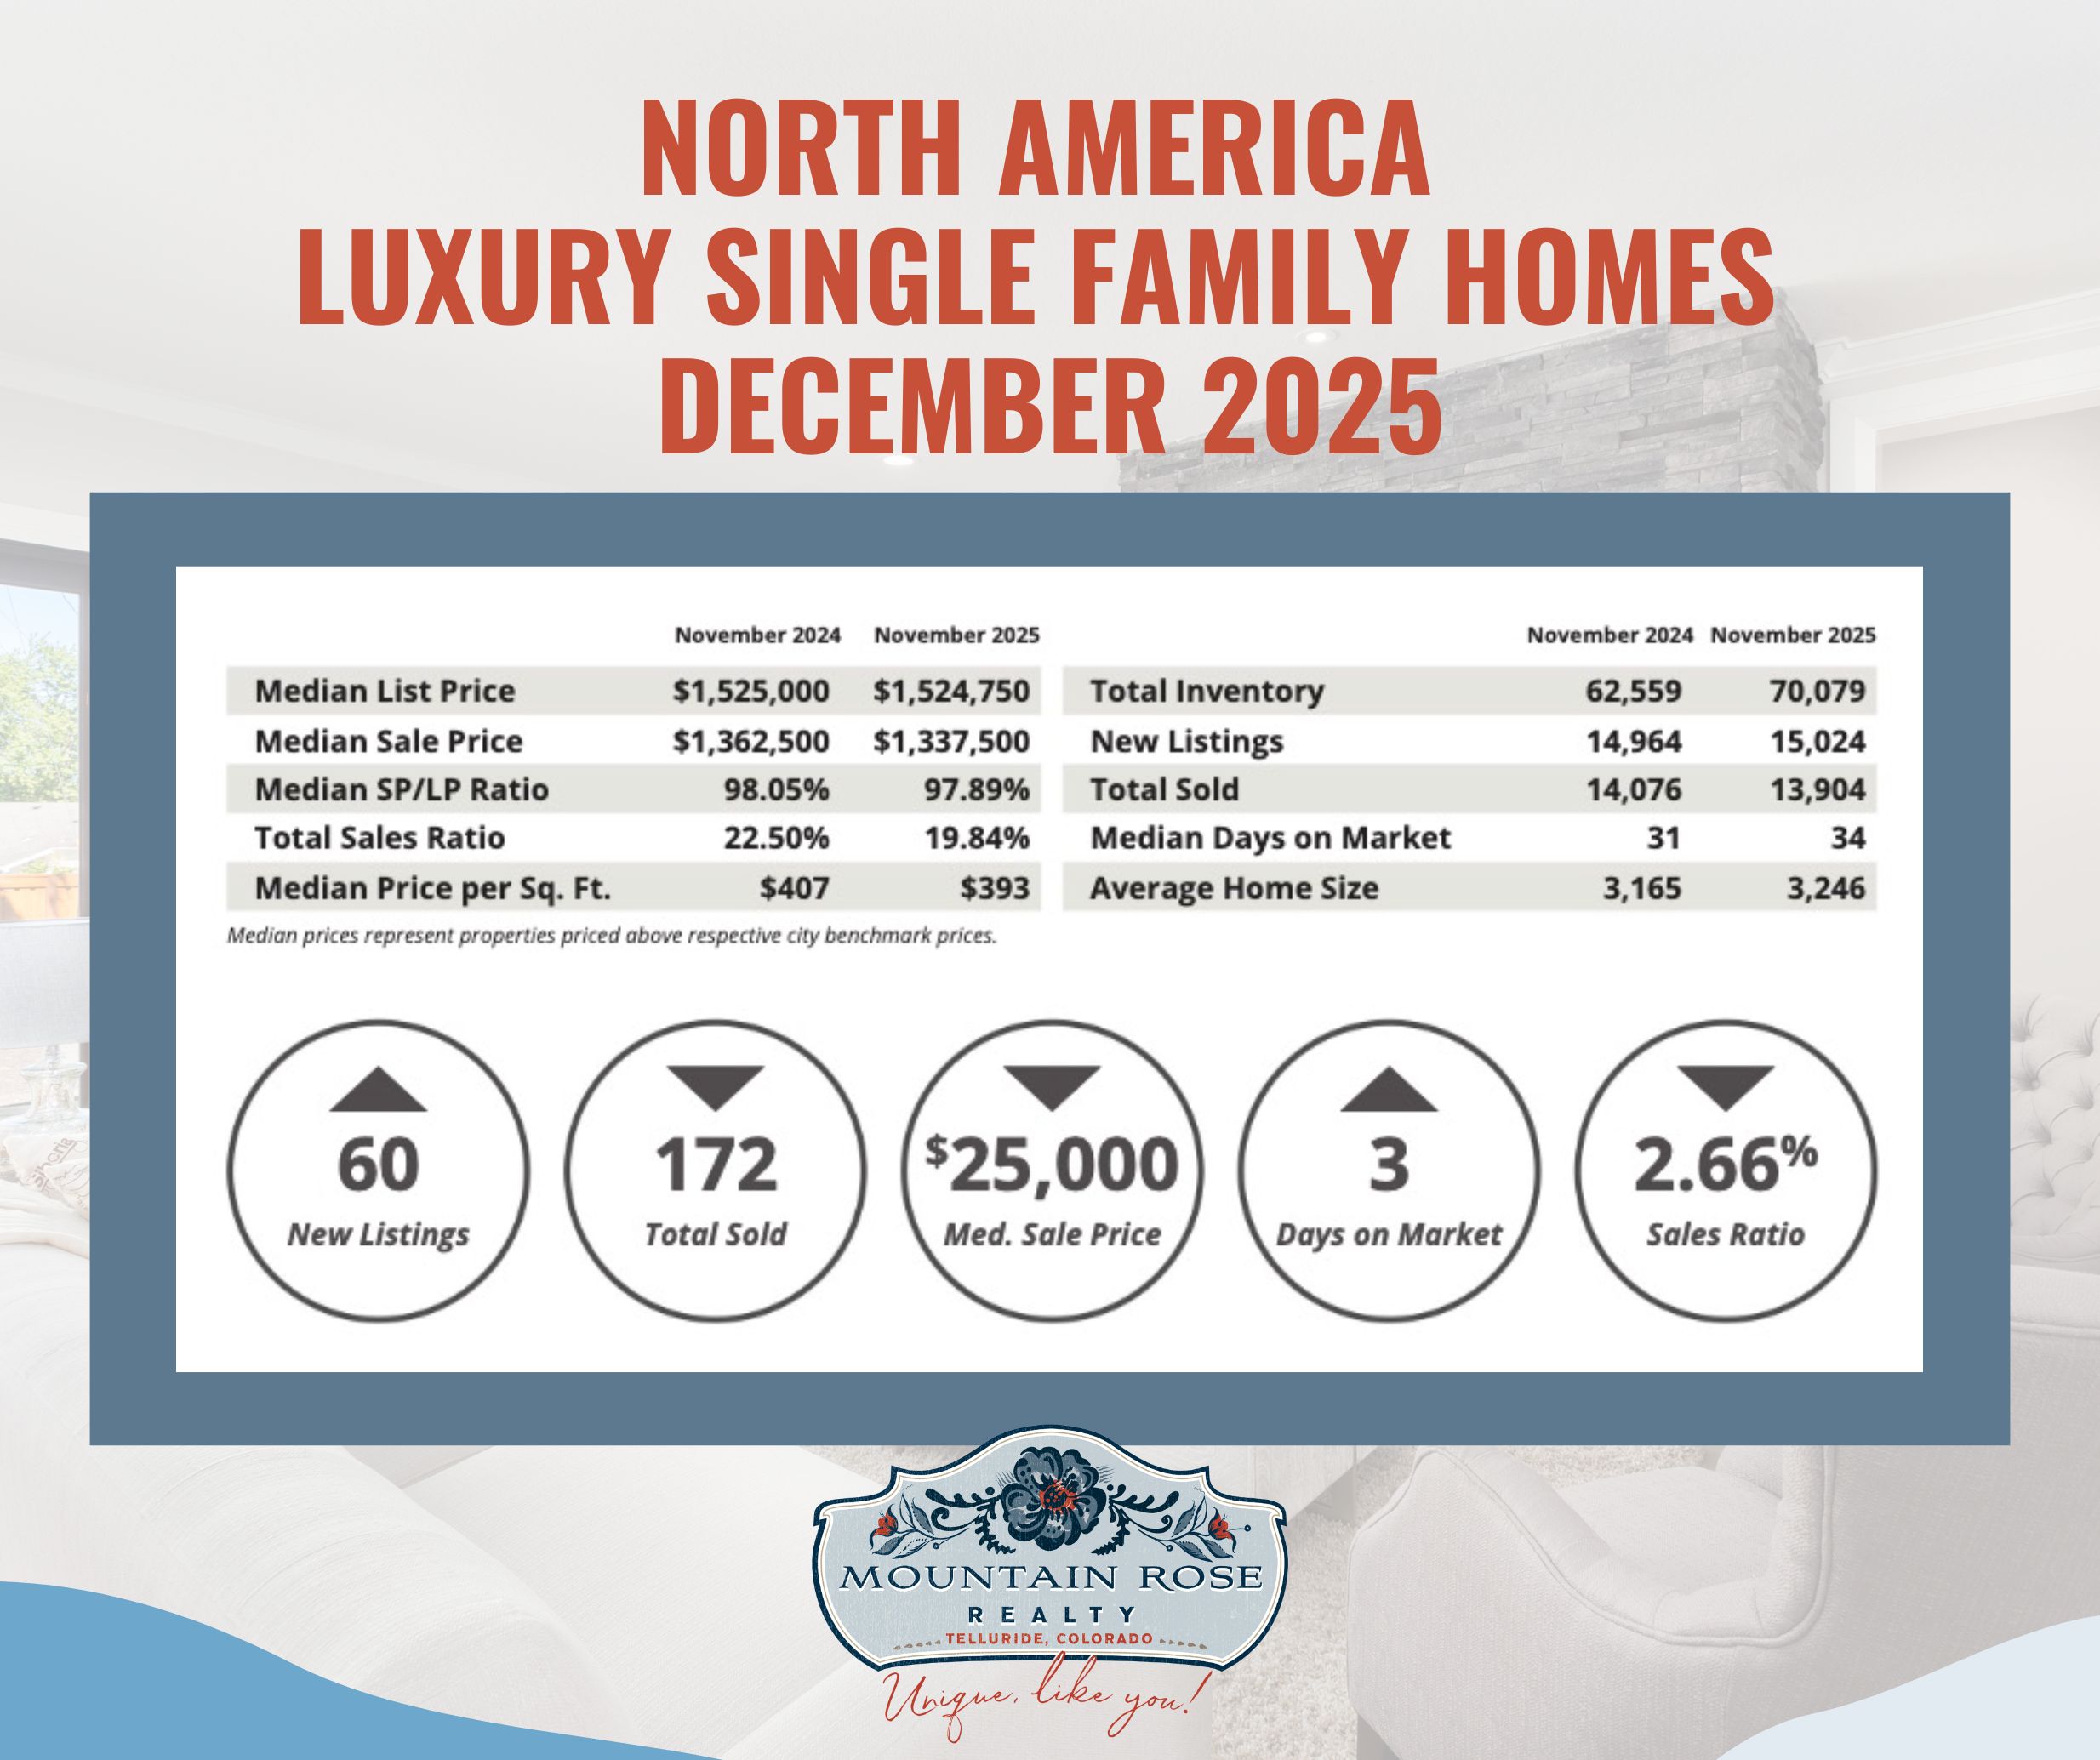
The retained table reports 70,079 properties in inventory and 13,904 sales, producing a 19.84% total sales ratio, classified as balanced under the report’s system. Inventory was 62,559 and sales were 14,076 in November 2024. More available inventory did not coincide with more sales in this comparison.
The sales ratio declined from 22.50% to 19.84%, a difference of 2.66 percentage points. The original summary also cited a $900,000 median luxury threshold. A threshold defines report inclusion; it is not a starting price for Telluride property.

The attached category covers the report’s condominium, townhome and other attached-home segment. Its table shows 25,677 inventory and 3,717 sales, a 14.48% sales ratio. The prior-year counts were 23,870 and 3,941, with a 16.51% ratio.
Chart correction: the attached graphic’s days-on-market callout shows a one-day decline, while both table entries read 35. This text follows the table and does not claim a one-day decline. The original summary cited a $700,000 median luxury threshold for this segment.
The attached median sale price rose while the single-family median fell. That difference can reflect the mix of transactions. The tables label the sale-to-list ratios as medians, so describing them as averages would be imprecise. Ratios near 98% do not establish that buyers paid a fair price, that a particular seller priced correctly or that a Telluride buyer can expect a fixed discount.
The summary’s $900,000 and $700,000 threshold figures are report context, separate from these reproduced comparison tables. Neither threshold is an appraisal, a local affordability measure or a promise of available inventory.
The Institute for Luxury Home Marketing uses market-specific luxury thresholds and selected markets across the United States and Canada. This is not a census of every North American home. A median describes the middle of the reported observations and can change when the mix of homes sold changes; it does not measure appreciation of the same properties.
Sales ratio compares reported sales with inventory. The Institute labels ratios below 12% a buyer’s market, 12% to below 21% balanced, and 21% or more a seller’s market. A ratio over 100% can occur when sales during the reporting period exceed the inventory snapshot. It does not mean homes sell that percentage faster, and it is not a price-growth rate.
Use the Institute’s report description for source context. Its underlying data come from several sources and are not guaranteed. The figures here are reported historical statistics, not independently reconstructed MLS results.
For a purchase or sale, compare current closed transactions and competing listings in the relevant location, property type and price band. Review condition, access, parking, maintenance, association finances and any rental restrictions separately. A report’s market label does not establish the negotiating room, rental permission or future value of an individual home.
Contact Anne-Britt Ostlund at Mountain Rose Realty to discuss the property and the evidence needed for your decision.