

Presented by Mountain Rose Realty and Anne-Britt Ostlund. The November 2025 edition describes October 2025 activity. Read the 22-page original report for the North American overview, individual markets and Telluride section. The earlier article called the entire market balanced; the publisher actually classified single-family luxury as a seller’s market and attached luxury as balanced.
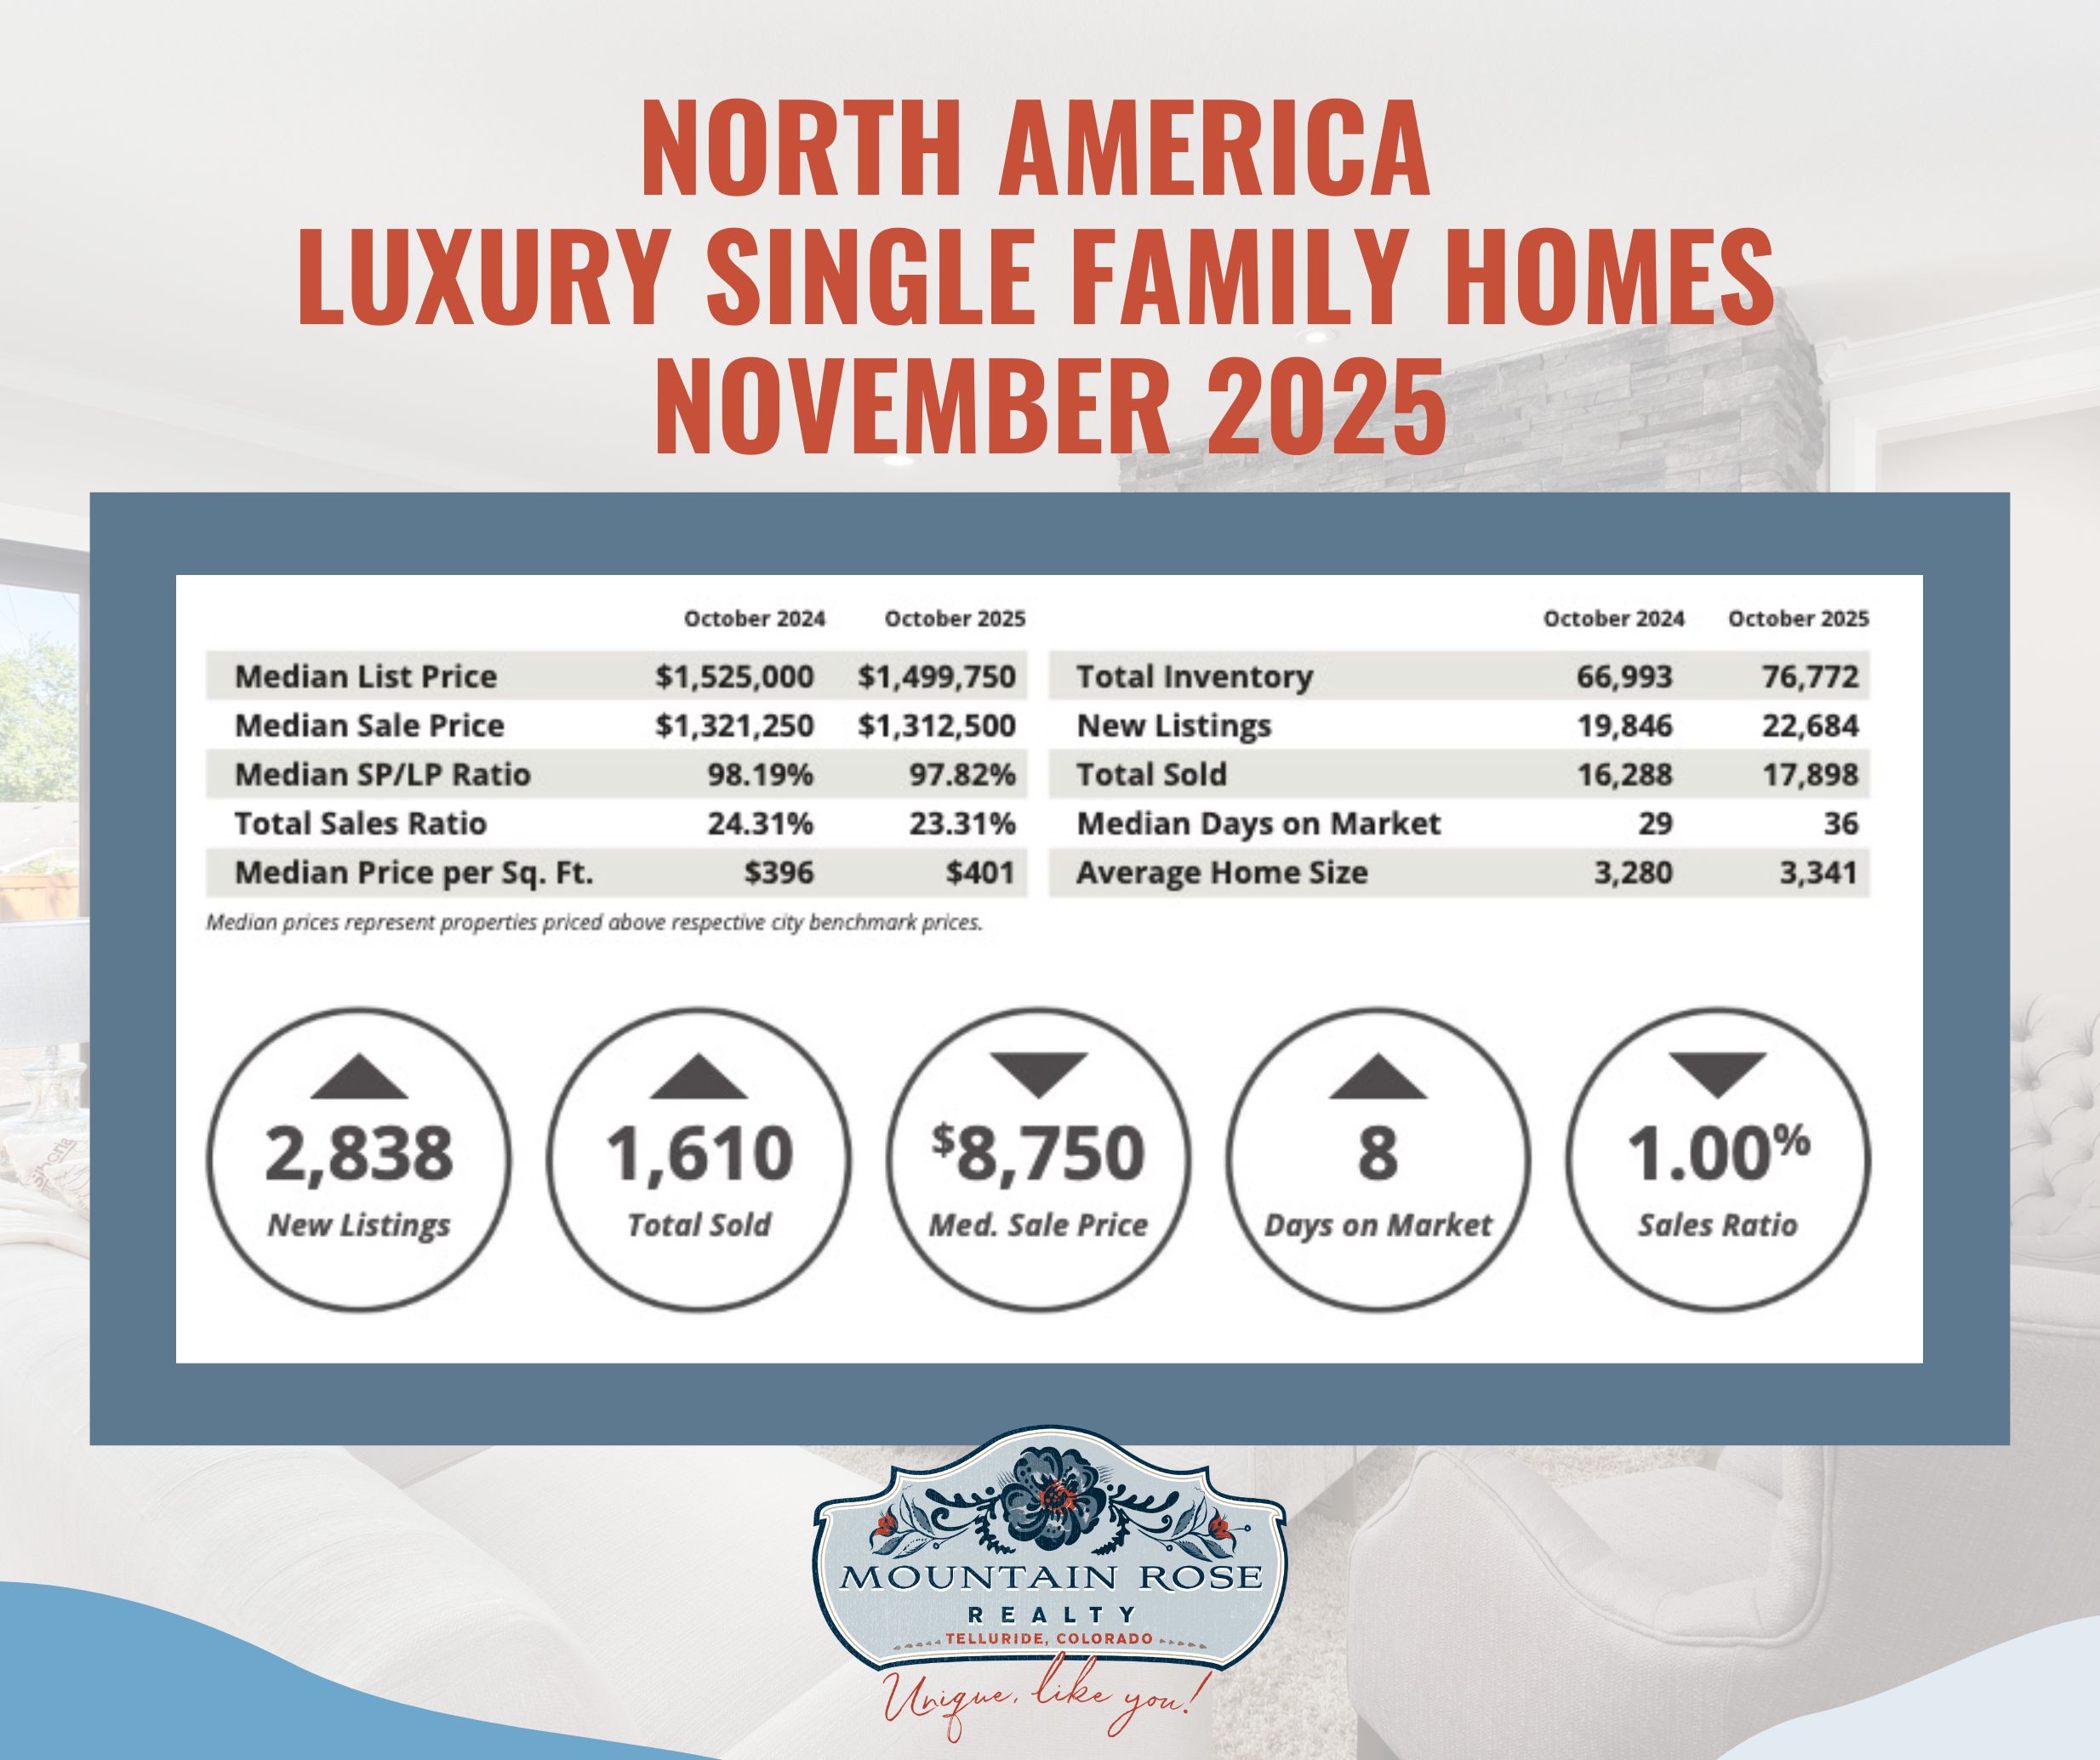
| Measure | Oct. 2024 | Oct. 2025 |
|---|---|---|
| Median list price | $1,525,000 | $1,499,750 |
| Median sale price | $1,321,250 | $1,312,500 |
| Median sale-to-list ratio | 98.19% | 97.82% |
| Total sales ratio | 24.31% | 23.31% |
| Median price per sq. ft. | $396 | $401 |
| Total inventory | 66,993 | 76,772 |
| New listings | 19,846 | 22,684 |
| Total sold | 16,288 | 17,898 |
| Median days on market | 29 | 36 |
| Average home size (sq. ft.) | 3,280 | 3,341 |
Sales increased by 1,610, about 9.9%, and inventory by about 14.6% year over year. New listings increased by 2,838; the median sale price declined by $8,750; and the sales ratio fell by 1.00 percentage point. At 23.31%, the category remained a seller’s market under the publisher’s framework. More sales do not by themselves establish stronger confidence among all buyers or sellers.
Graphic correction: The preserved image’s badge reports an eight-day increase in days on market, but its table shows 29 to 36, which is seven days. The original article also discussed 6.5% month-over-month sales growth. That is a separate comparison from the year-over-year table and should not be inferred from these two October columns.
The publisher lists the highest single-family median sale prices as Pitkin County ($11,375,000), Eagle County ($5,125,000), Whistler ($4,535,000) and Paradise Valley ($4,400,000). These are not the highest individual sales. Its highest sales-ratio list names San Francisco (114.30%), Baltimore City (85.00%), Silicon Valley (79.20%) and East Bay (66.60%).
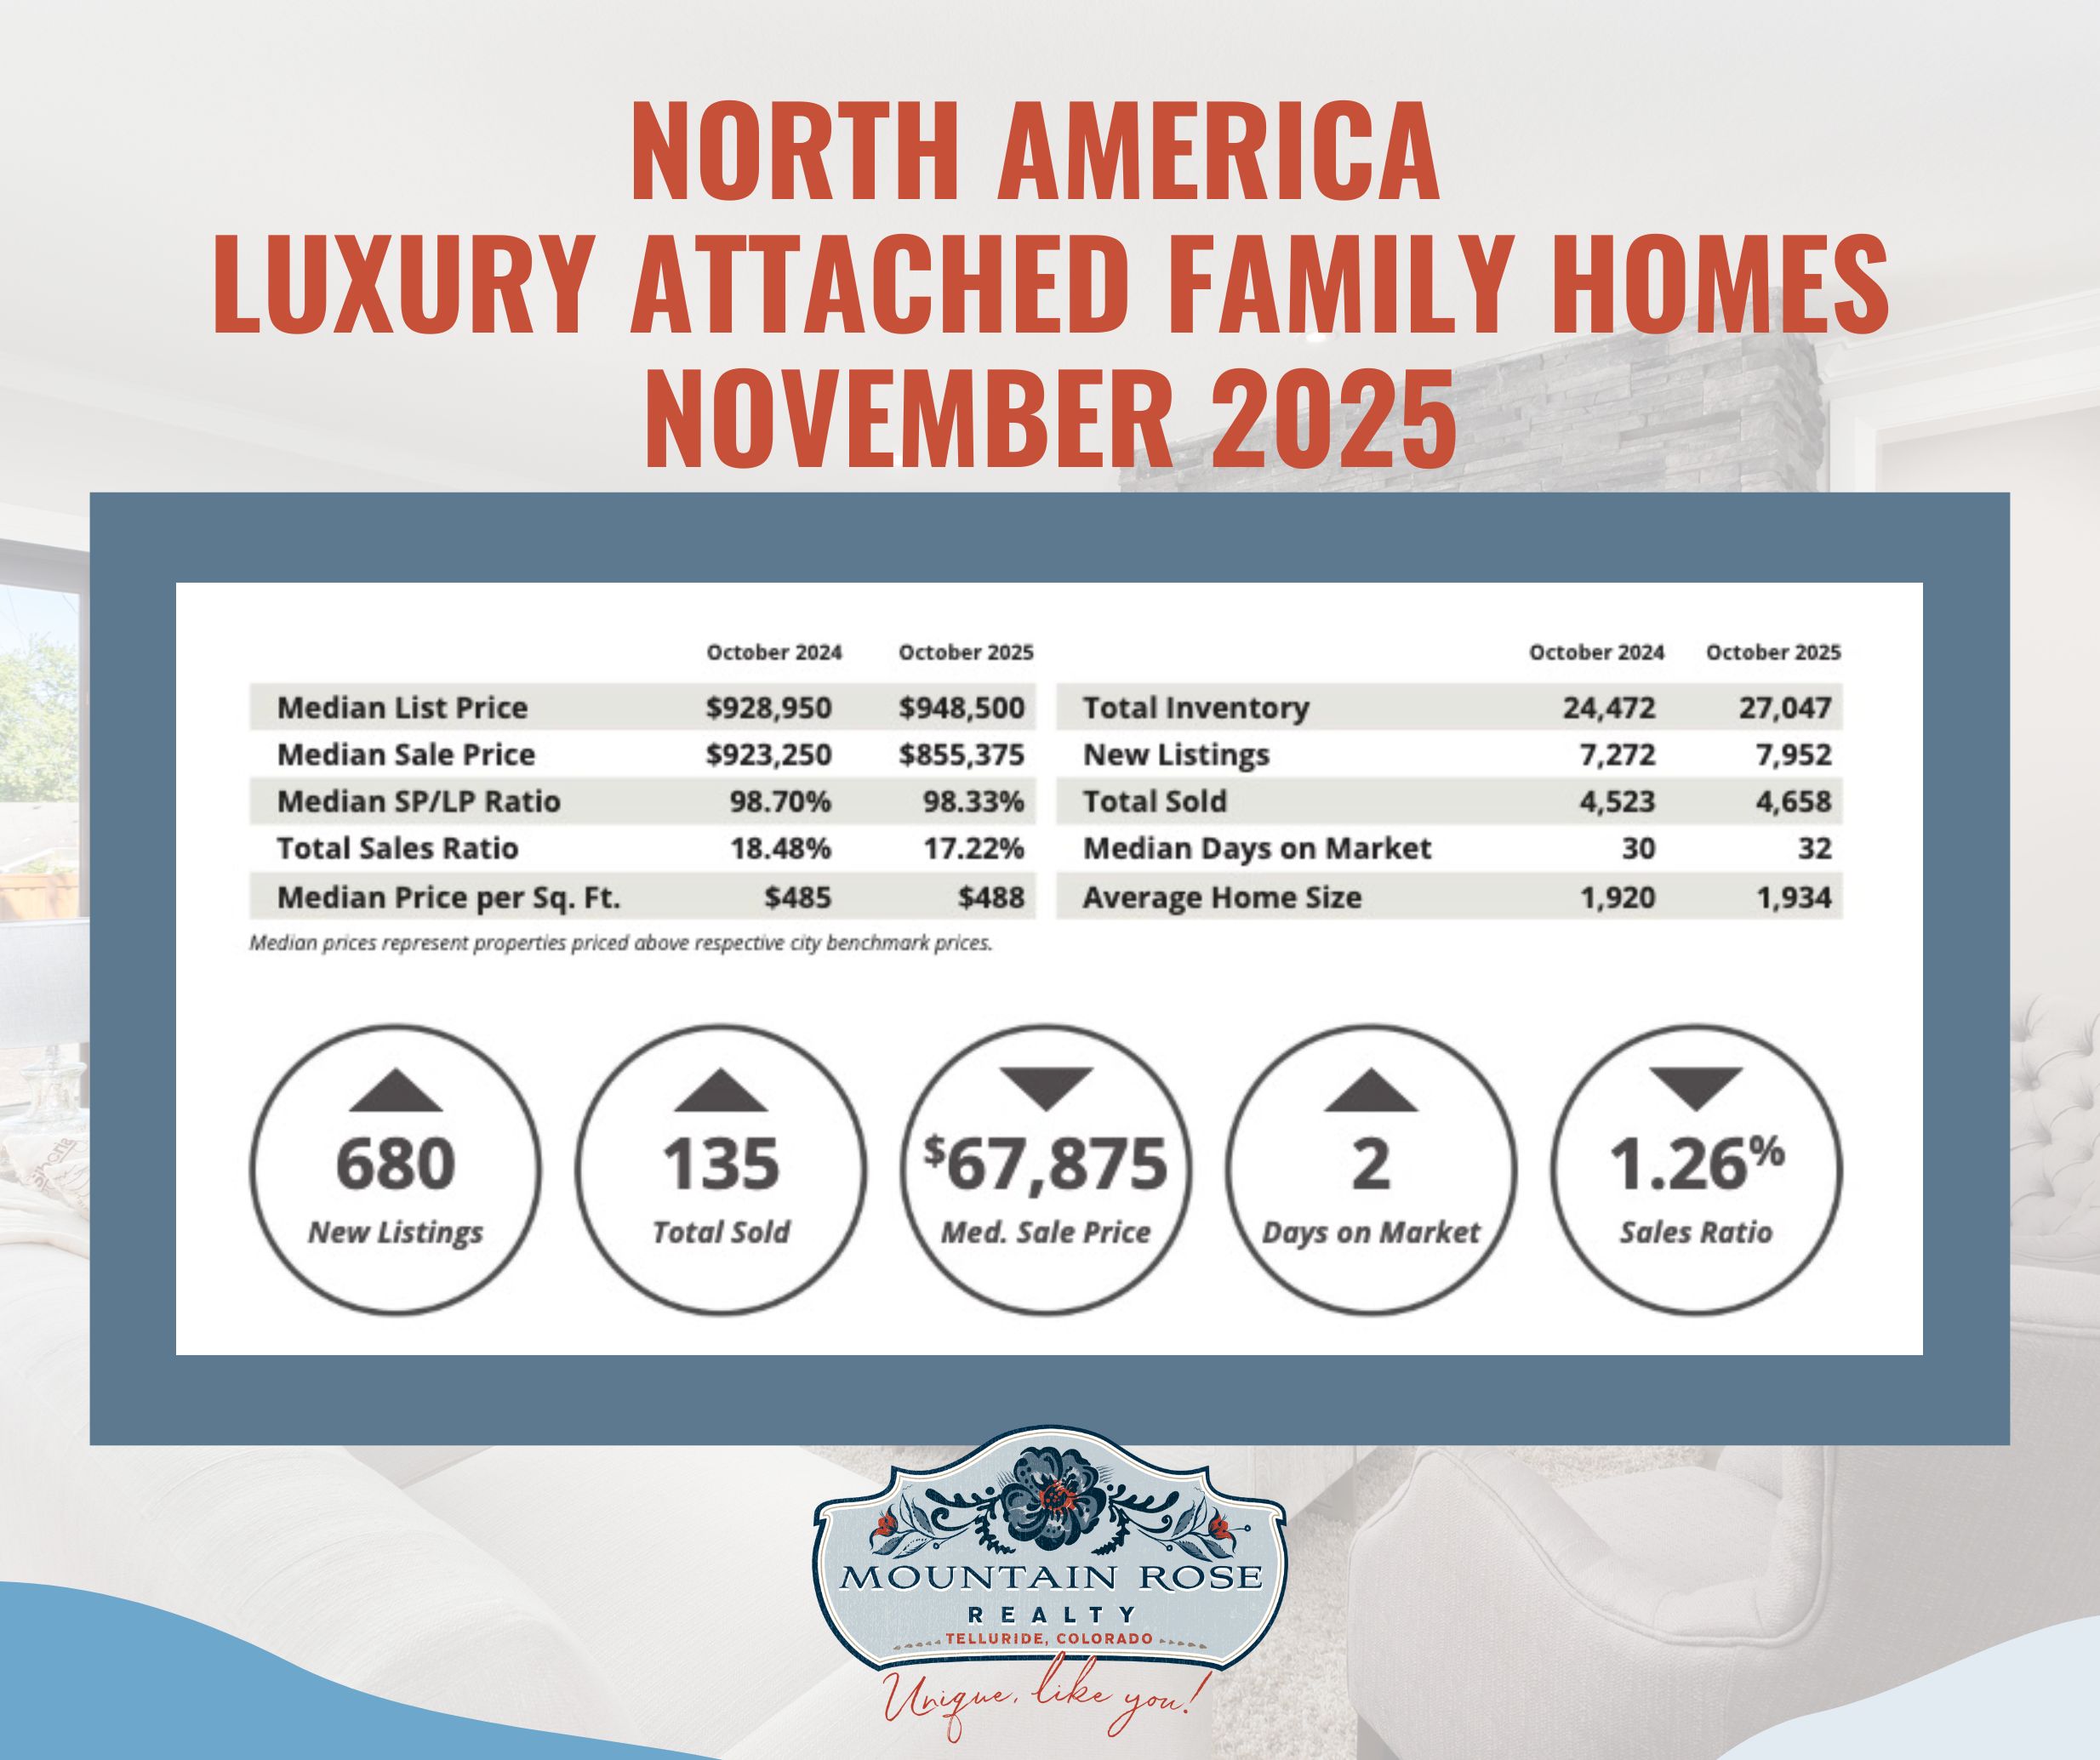
| Measure | Oct. 2024 | Oct. 2025 |
|---|---|---|
| Median list price | $928,950 | $948,500 |
| Median sale price | $923,250 | $855,375 |
| Median sale-to-list ratio | 98.70% | 98.33% |
| Total sales ratio | 18.48% | 17.22% |
| Median price per sq. ft. | $485 | $488 |
| Total inventory | 24,472 | 27,047 |
| New listings | 7,272 | 7,952 |
| Total sold | 4,523 | 4,658 |
| Median days on market | 30 | 32 |
| Average home size (sq. ft.) | 1,920 | 1,934 |
The attached category added 680 new listings and 135 sales compared with October 2024. Its median sale price fell by $67,875, about 7.35%, and median days on market rose by two. The sales ratio declined by 1.26 percentage points to 17.22%, classified as balanced. The sale-to-list ratio also declined year over year, from 98.70% to 98.33%.
A changing mix of properties can influence the median, but this table does not prove that rate relief brought in more mid-tier buyers or fully explain the price decline. It also cannot establish a second consecutive monthly gain without the preceding months’ data.
The publisher’s highest attached median-price list names Pitkin County ($3,062,500), Park City ($2,895,000), Whistler ($2,800,000) and San Francisco ($2,495,000). Its highest sales ratios were Morris County, New Jersey (123.50%), Fairfax County, Virginia (77.60%), Coastal Connecticut (63.90%) and Howard County, Maryland (61.10%).
The Institute for Luxury Home Marketing sets market-specific luxury thresholds; the stated $900,000 single-family and $700,000 attached figures are median thresholds across the report, not universal entry prices or Telluride benchmarks. Its categories use sales ratios below 12% for buyer’s markets, 12% to below 21% for balanced markets, and 21% or more for seller’s markets. Those labels describe the publisher’s framework, not every property’s bargaining position.
The comparison tables label SP/LP as a median sale-to-list ratio, although the summary prose calls it an average. We use the table label. It differs from the sales ratio, which relates sales to inventory. A sales ratio can exceed 100% because the report compares period sales with inventory; it is not an individual listing’s probability of sale. Ratio changes below are percentage-point differences, not relative percentage changes.
Prices describe transactions above each city’s benchmark, not changes in value for the same homes. Canadian city prices are shown in Canadian dollars, so the publisher’s cross-market price lists are not currency-adjusted investment rankings. These North American aggregates do not establish current conditions in Telluride.
For buyers, compare current alternatives and terms before treating a historical market label as a reason to act urgently. For sellers, assess pricing, condition, presentation and competing inventory. These are useful decisions within your control; this report does not guarantee premium valuations or predict that competition will tighten.
Contact Anne-Britt Ostlund at Mountain Rose Realty for a current Telluride property comparison. Her brokerage profile describes her background and services for buyers and sellers. Follow Facebook and Instagram for updates.