

Presented by Mountain Rose Realty and Anne-Britt Ostlund. This is a historical report edition covering September 2025, with September 2024 comparisons. Read the original luxury market report for its full market coverage and definitions. The edition month and the period measured are different.
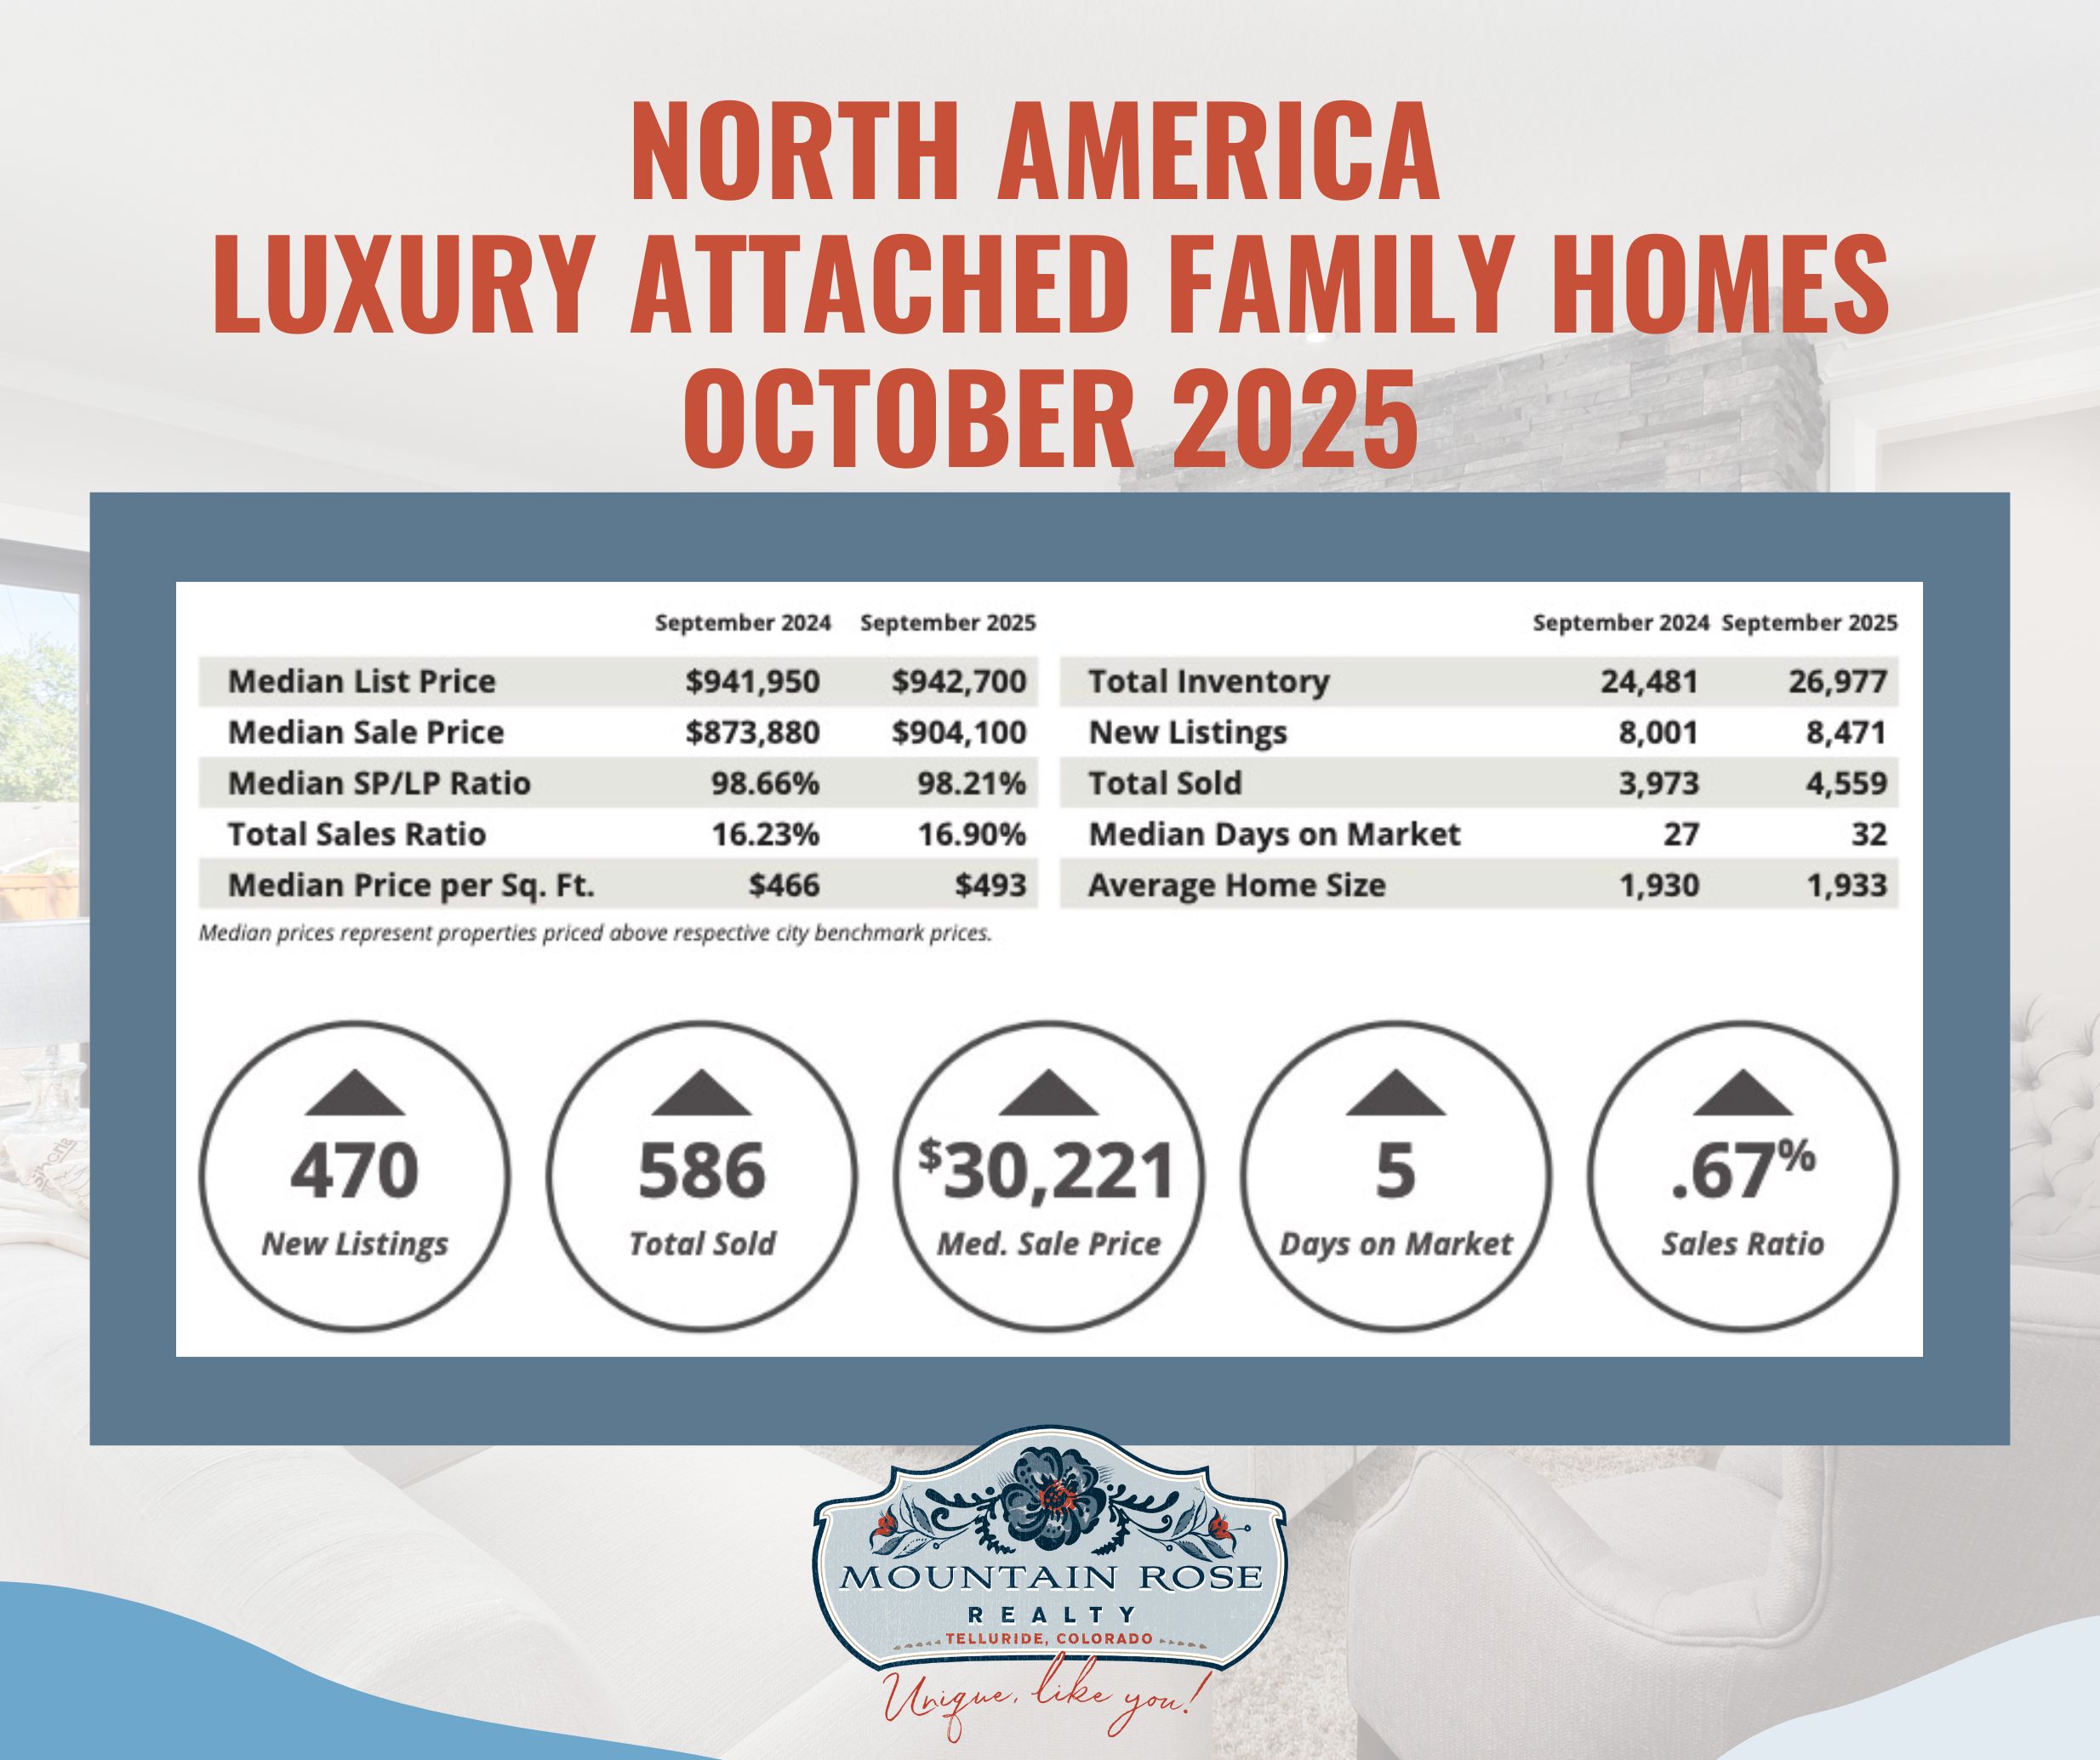
The table shows a 16.90% total sales ratio, within the report’s balanced range. Inventory rose from 24,481 to 26,977 and sales from 3,973 to 4,559. The 16.23% prior-year ratio increased by 0.67 percentage points.
Chart correction: the displayed median sale prices differ by $30,220; the callout says $30,221. This text uses the table values. The original report summary also cited a $700,000 median luxury threshold.
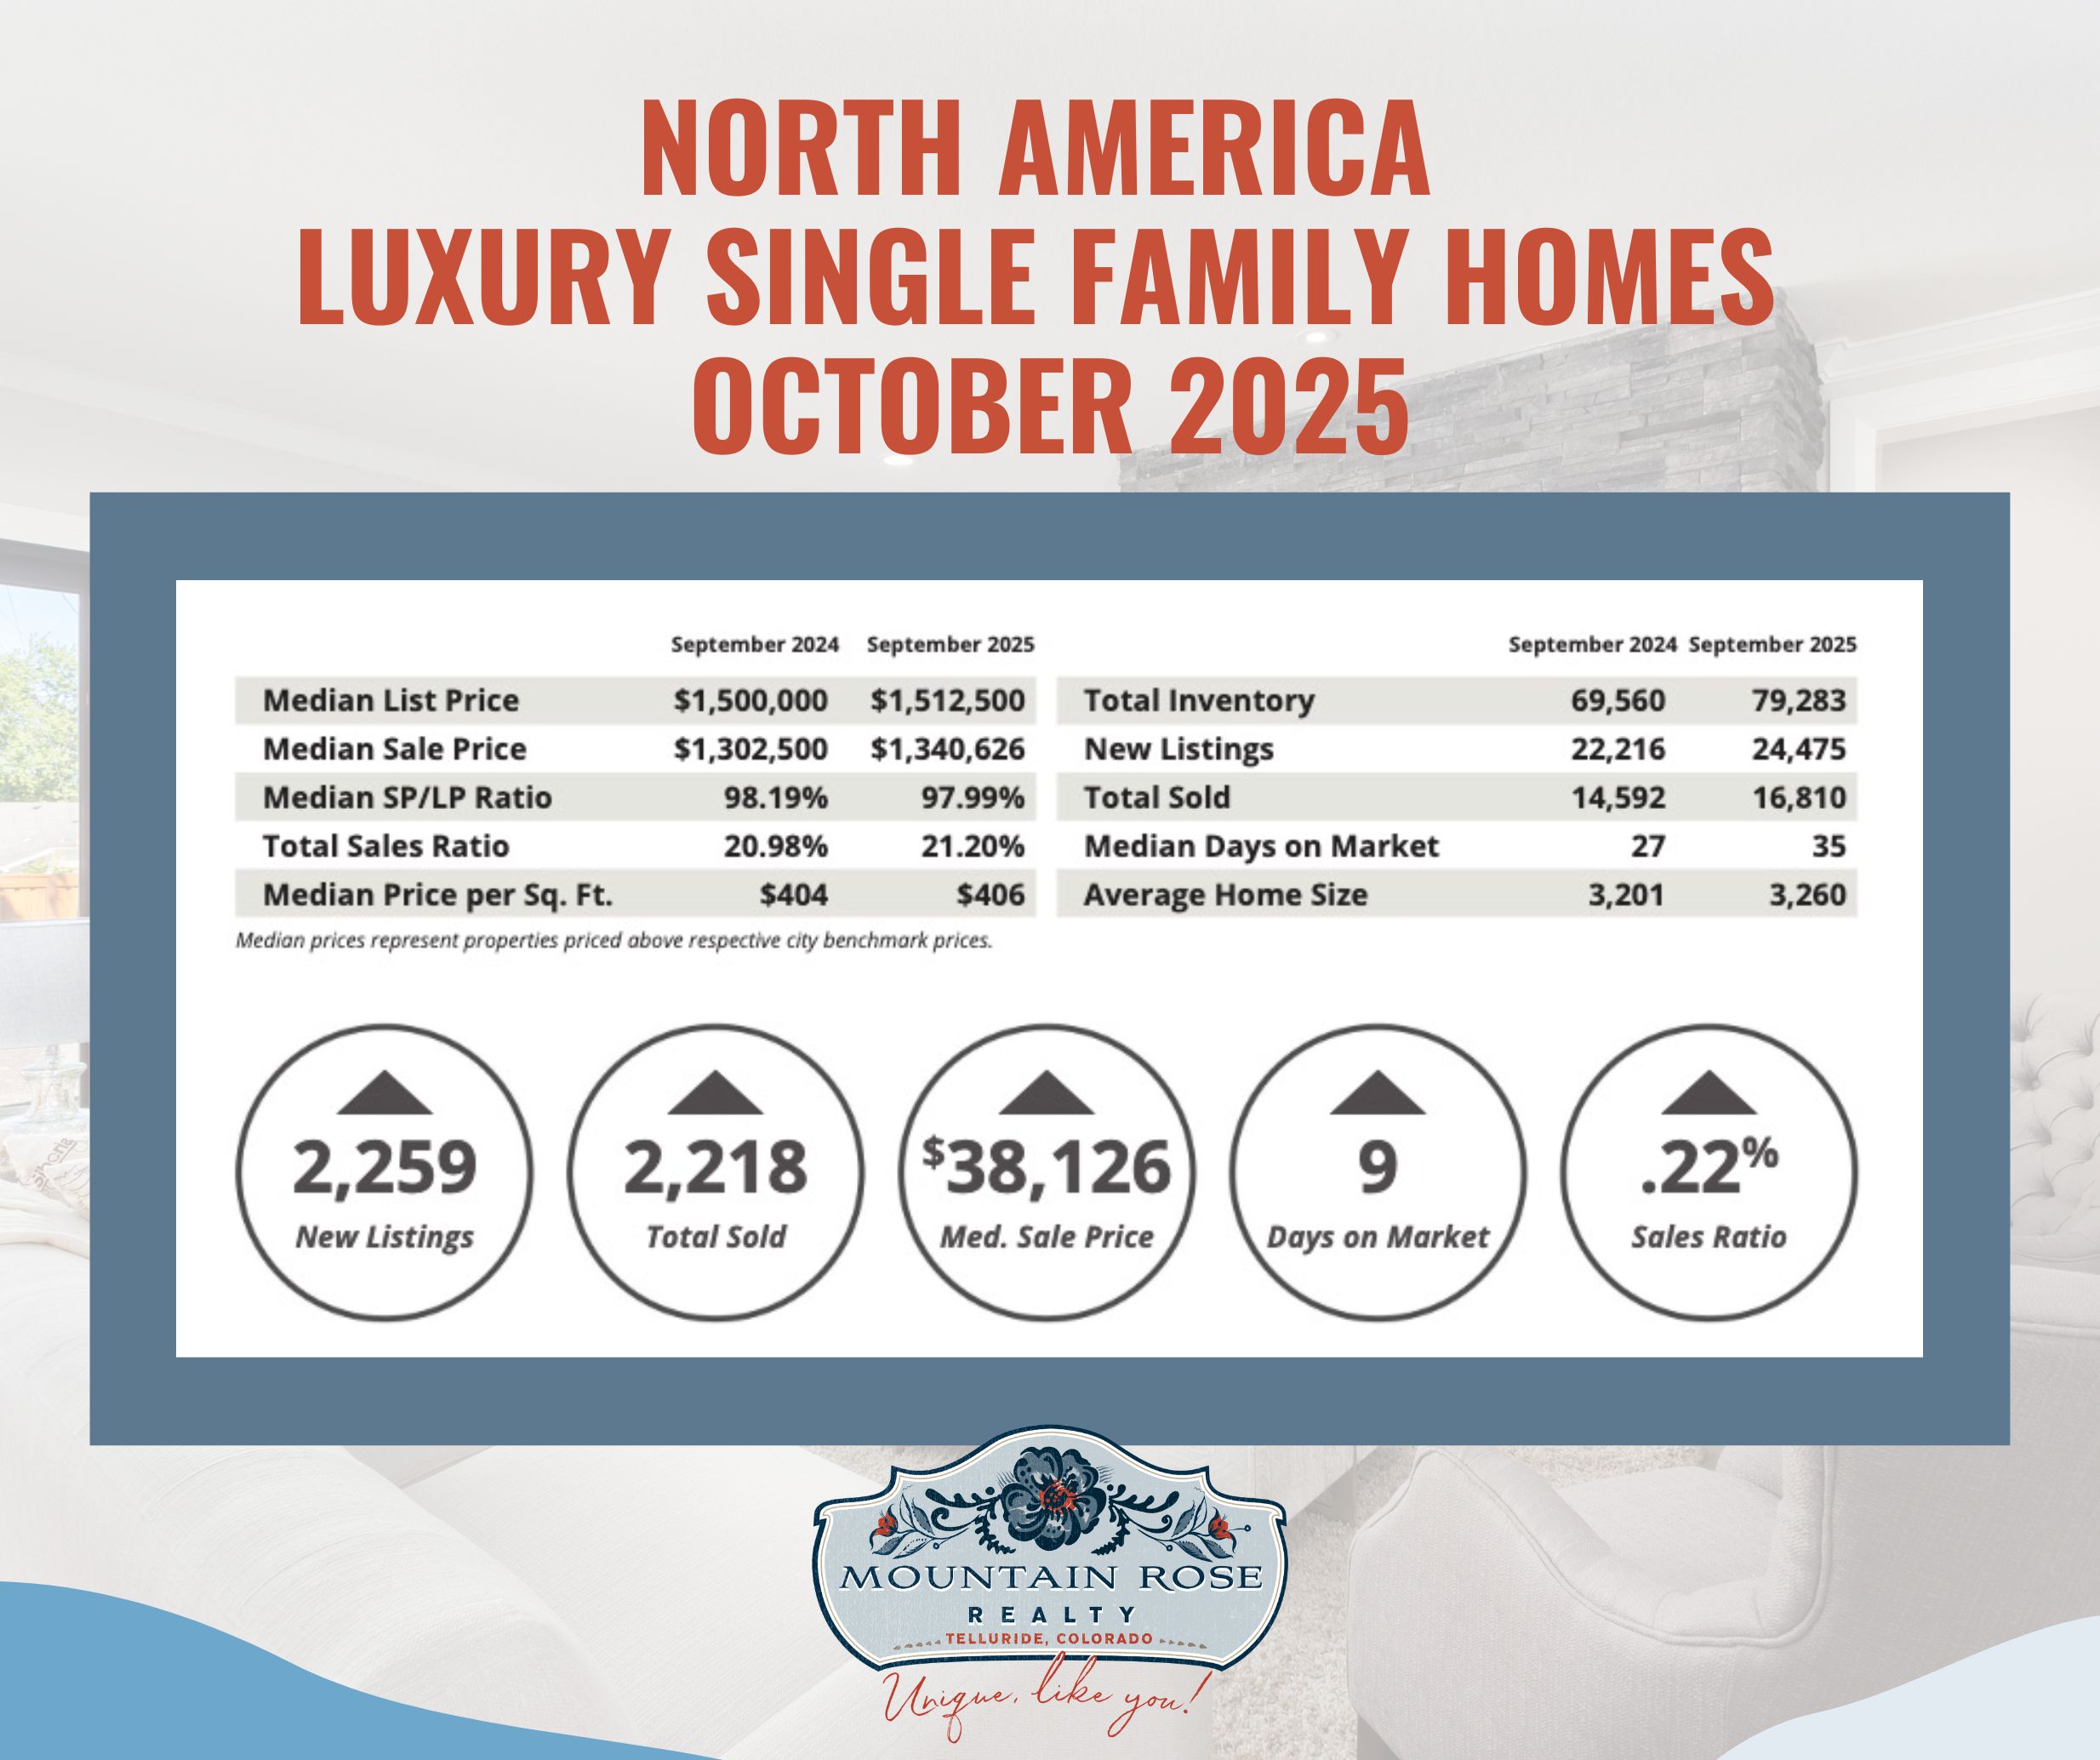
The single-family total sales ratio was 21.20%, just within the report’s seller’s-market range, compared with 20.98% a year earlier. The table lists 79,283 inventory and 16,810 sales, versus 69,560 and 14,592.
Chart correction: 35 minus 27 is eight days, while the graphic callout says nine. The table supports an eight-day difference. The original summary cited a $900,000 median luxury threshold.
The original September summary named attached median sale prices in Pitkin County ($3,100,000), San Francisco ($2,622,500), Park City ($2,600,000) and Whistler ($2,274,000). It named attached sales ratios in Morris County (81.8%), Fairfax County (76.2%), DuPage County (73.8%) and McLean & Vienna (69.4%).
For single-family homes, it listed Pitkin County ($11,800,000), Telluride ($5,612,500), Paradise Valley ($4,138,717) and Eagle County ($4,125,000), with high sales ratios in the Cleveland suburbs (73.3%), Silicon Valley (65.7%), Central Connecticut (57.6%) and San Francisco (57.5%). These are retained as dated report-summary figures; the reproduced aggregate tables do not independently verify those individual market samples or resolve currency treatment for Canadian markets.
A high reported median is not a performance ranking or a measure of appreciation. A sales ratio is not a sale-price premium. In particular, the aggregate 21.20% label cannot be assigned to Telluride solely because Telluride appears in a price list. Request the underlying local report and comparable transactions before applying these figures to a property.
The Institute for Luxury Home Marketing uses market-specific luxury thresholds and selected markets across the United States and Canada. This is not a census of every North American home. A median describes the middle of the reported observations and can change when the mix of homes sold changes; it does not measure appreciation of the same properties.
Sales ratio compares reported sales with inventory. The Institute labels ratios below 12% a buyer’s market, 12% to below 21% balanced, and 21% or more a seller’s market. A ratio over 100% can occur when sales during the reporting period exceed the inventory snapshot. It does not mean homes sell that percentage faster, and it is not a price-growth rate.
Use the Institute’s report description for source context. Its underlying data come from several sources and are not guaranteed. The figures here are reported historical statistics, not independently reconstructed MLS results.
For a purchase or sale, compare current closed transactions and competing listings in the relevant location, property type and price band. Review condition, access, parking, maintenance, association finances and any rental restrictions separately. A report’s market label does not establish the negotiating room, rental permission or future value of an individual home.
Contact Anne-Britt Ostlund at Mountain Rose Realty to discuss the property and the evidence needed for your decision.