

April 2023 mortgage-payment example. The original chart illustrates how an interest-rate change can affect a modeled payment. Its 6%–7% rates are scenarios from the article's historical context, not current lender offers.
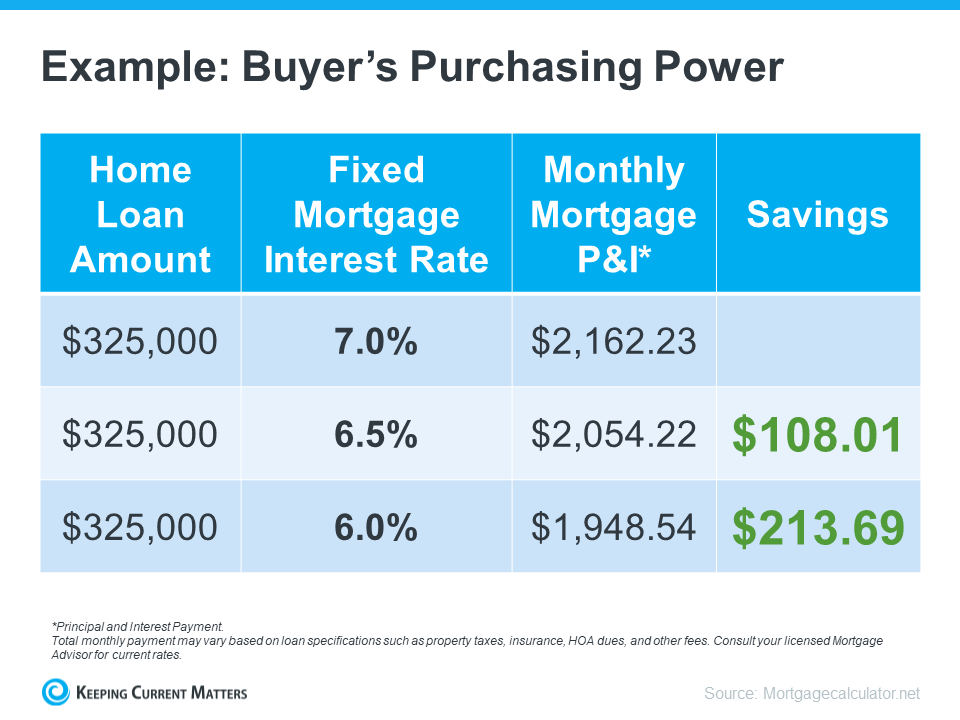
The chart shows principal and interest of $2,162.23 per month at 7.0%, $2,054.22 at 6.5% and $1,948.54 at 6.0% for its $325,000 home-loan example. Its displayed reductions from the 7% scenario are $108.01 and $213.69 per month. These figures illustrate payment sensitivity under the chart's assumptions; the actual result depends on loan amount, term and product.
A change from 7.0% to 6.5% is half a percentage point. The principal-and-interest calculation is not the total ownership payment: taxes, insurance, mortgage insurance, HOA dues and other costs may also apply. Points, fees and rate-lock terms also matter when comparing offers.
Future rates are uncertain, so this chart is not an instruction to buy now or to wait. Compare current lender scenarios using consistent loan assumptions and your cash reserves. The CFPB Loan Estimate explainer shows how to review loan terms, payments, closing costs and cash to close. A lender can explain eligibility and quote terms; a broker can help compare homes and transaction options.
For help comparing local properties and sale context, contact Anne-Britt Ostlund at Mountain Rose Realty.