

This March 2023 article discussed the rise in home prices during the preceding five years. Its original images are retained below as historical material. Their dates matter: a national or state price trend does not measure the equity in a particular Telluride-area home today.

The map is labeled “Percent Change in Home Prices,” “Over 5 Years,” and “Q4 2022,” with FHFA named as its source. It displays a national figure of 58.4% and a Colorado figure of 58.6%. Those are the figures printed on the archived graphic, not new estimates for the current market.
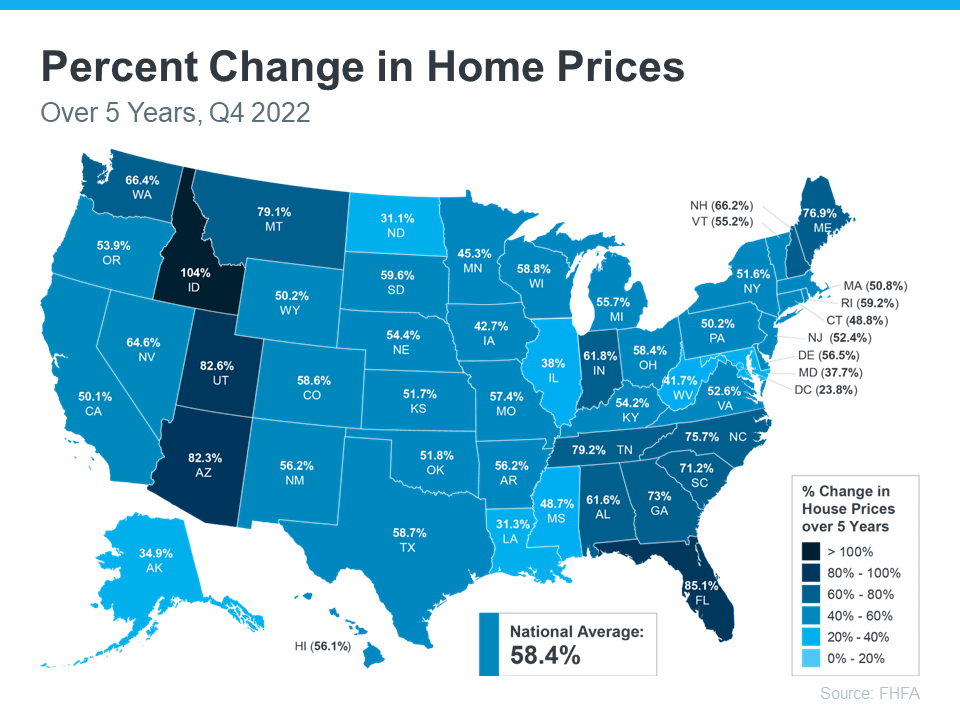
Archived graphic: five-year house-price changes through Q4 2022. State and national figures are not Telluride sale prices or a homeowner-equity calculation.
The Federal Housing Finance Agency’s House Price Index tracks house-price movements using repeat transactions. A price index describes a market pattern. It does not know your mortgage balance, improvements, property condition, liens, or the price a buyer will agree to pay for your home.
A working equity estimate starts with an estimated property value and subtracts debt secured by the property. Net sale proceeds also account for the transaction: mortgage and other lien payoffs, agreed selling costs, concessions, prorations, and any other amounts charged at closing. Neither the map nor the original article establishes those amounts for an individual owner.
The CFPB’s Closing Disclosure explainer helps a buyer review loan terms, closing costs, and cash to close. For a local sale analysis, contact Anne-Britt Ostlund at Mountain Rose Realty. An estimate supports planning; it does not guarantee a sale price, proceeds, or loan approval.