

July 2024 report archive, covering June 2024. Mountain Rose Realty and Anne-Britt Ostlund presented this North America luxury-market report. The original introduction described a 24-page edition covering Telluride and other U.S. and Canadian resort markets, with monthly statistics and a 13-month trend review. Read the original report alongside the retained charts below.
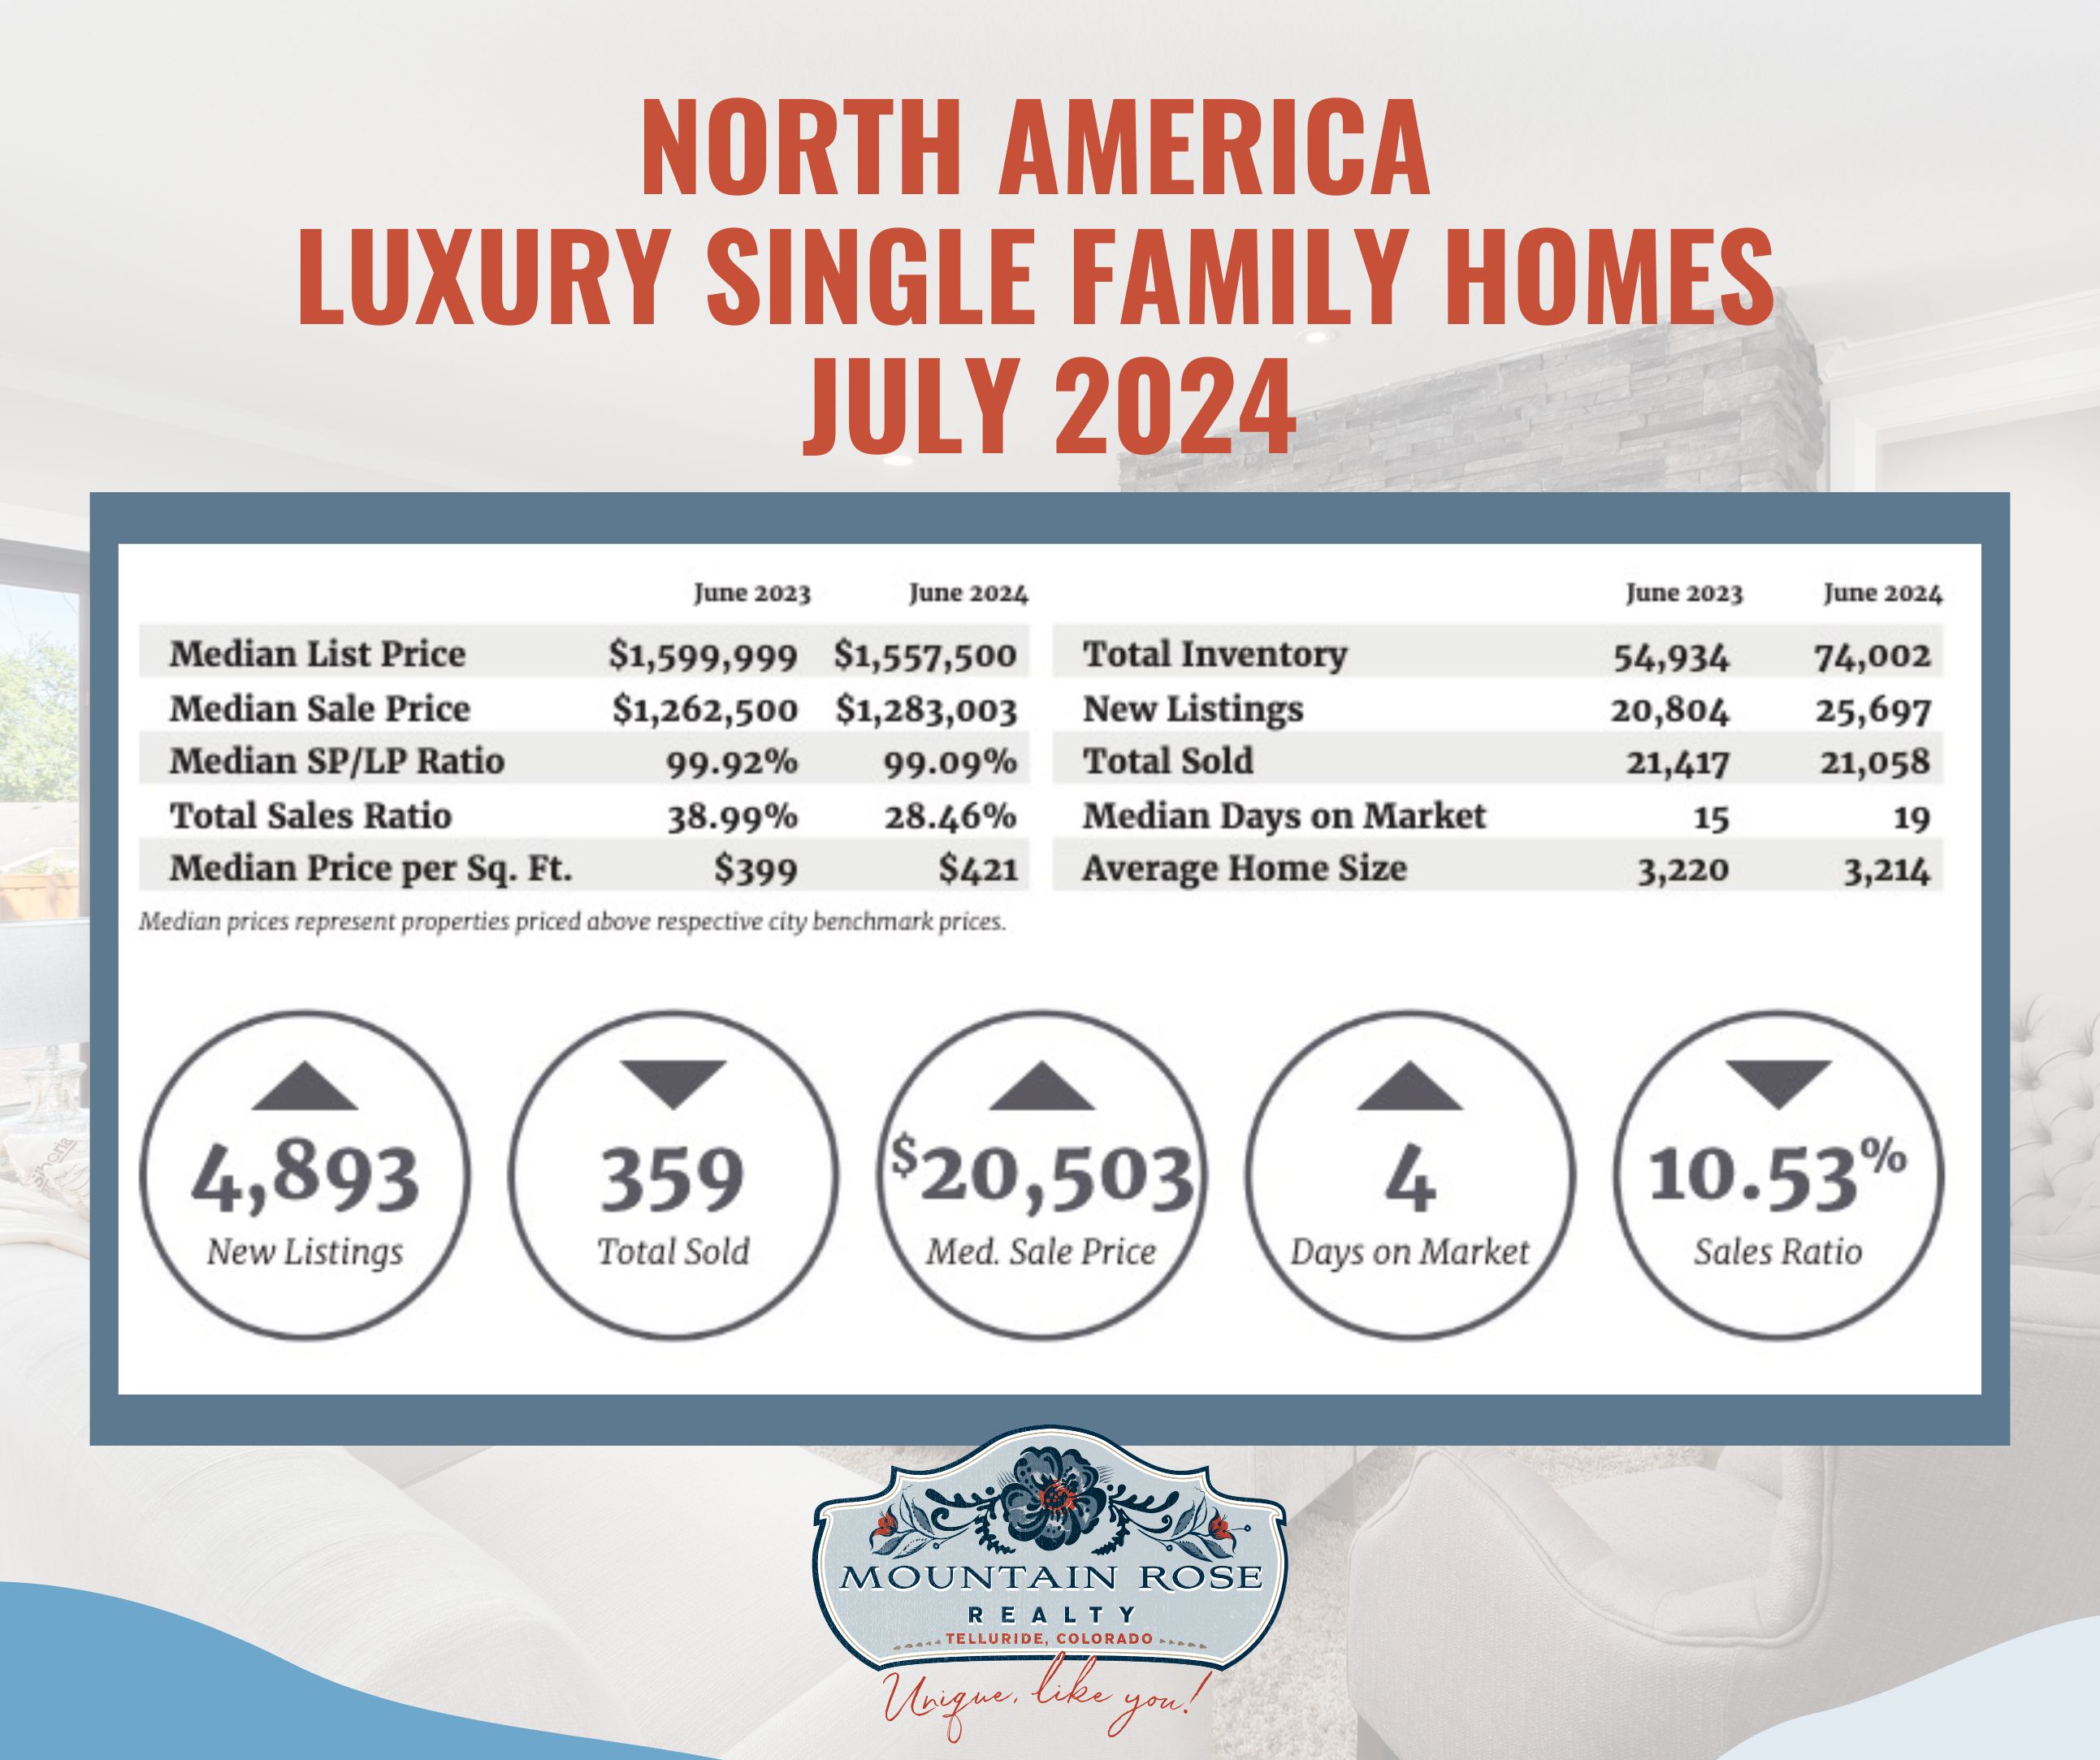
The North America graphic compares June 2023 with June 2024. For June 2024 it prints a 28.46% total sales ratio, a $1,283,003 median sale price and a 99.09% median sale-price-to-list-price ratio. The original prose called that last figure an average; the chart’s literal median label is used here. The narrative reported a $912,500 median luxury threshold and classified the category as a seller’s market.
The original summary listed these high median sale prices: Telluride $6,588,660; Whistler $6,512,500; Paradise Valley $4,100,000; and Los Angeles Beach Cities $4,095,000. Its high sales-ratio comparisons were Howard County, Maryland 108.4%; St. Louis 102.6%; East Bay 93.7%; and Baltimore City 84.2%. Those local comparisons are retained as the original summary’s figures; the North America image does not display the underlying local samples.
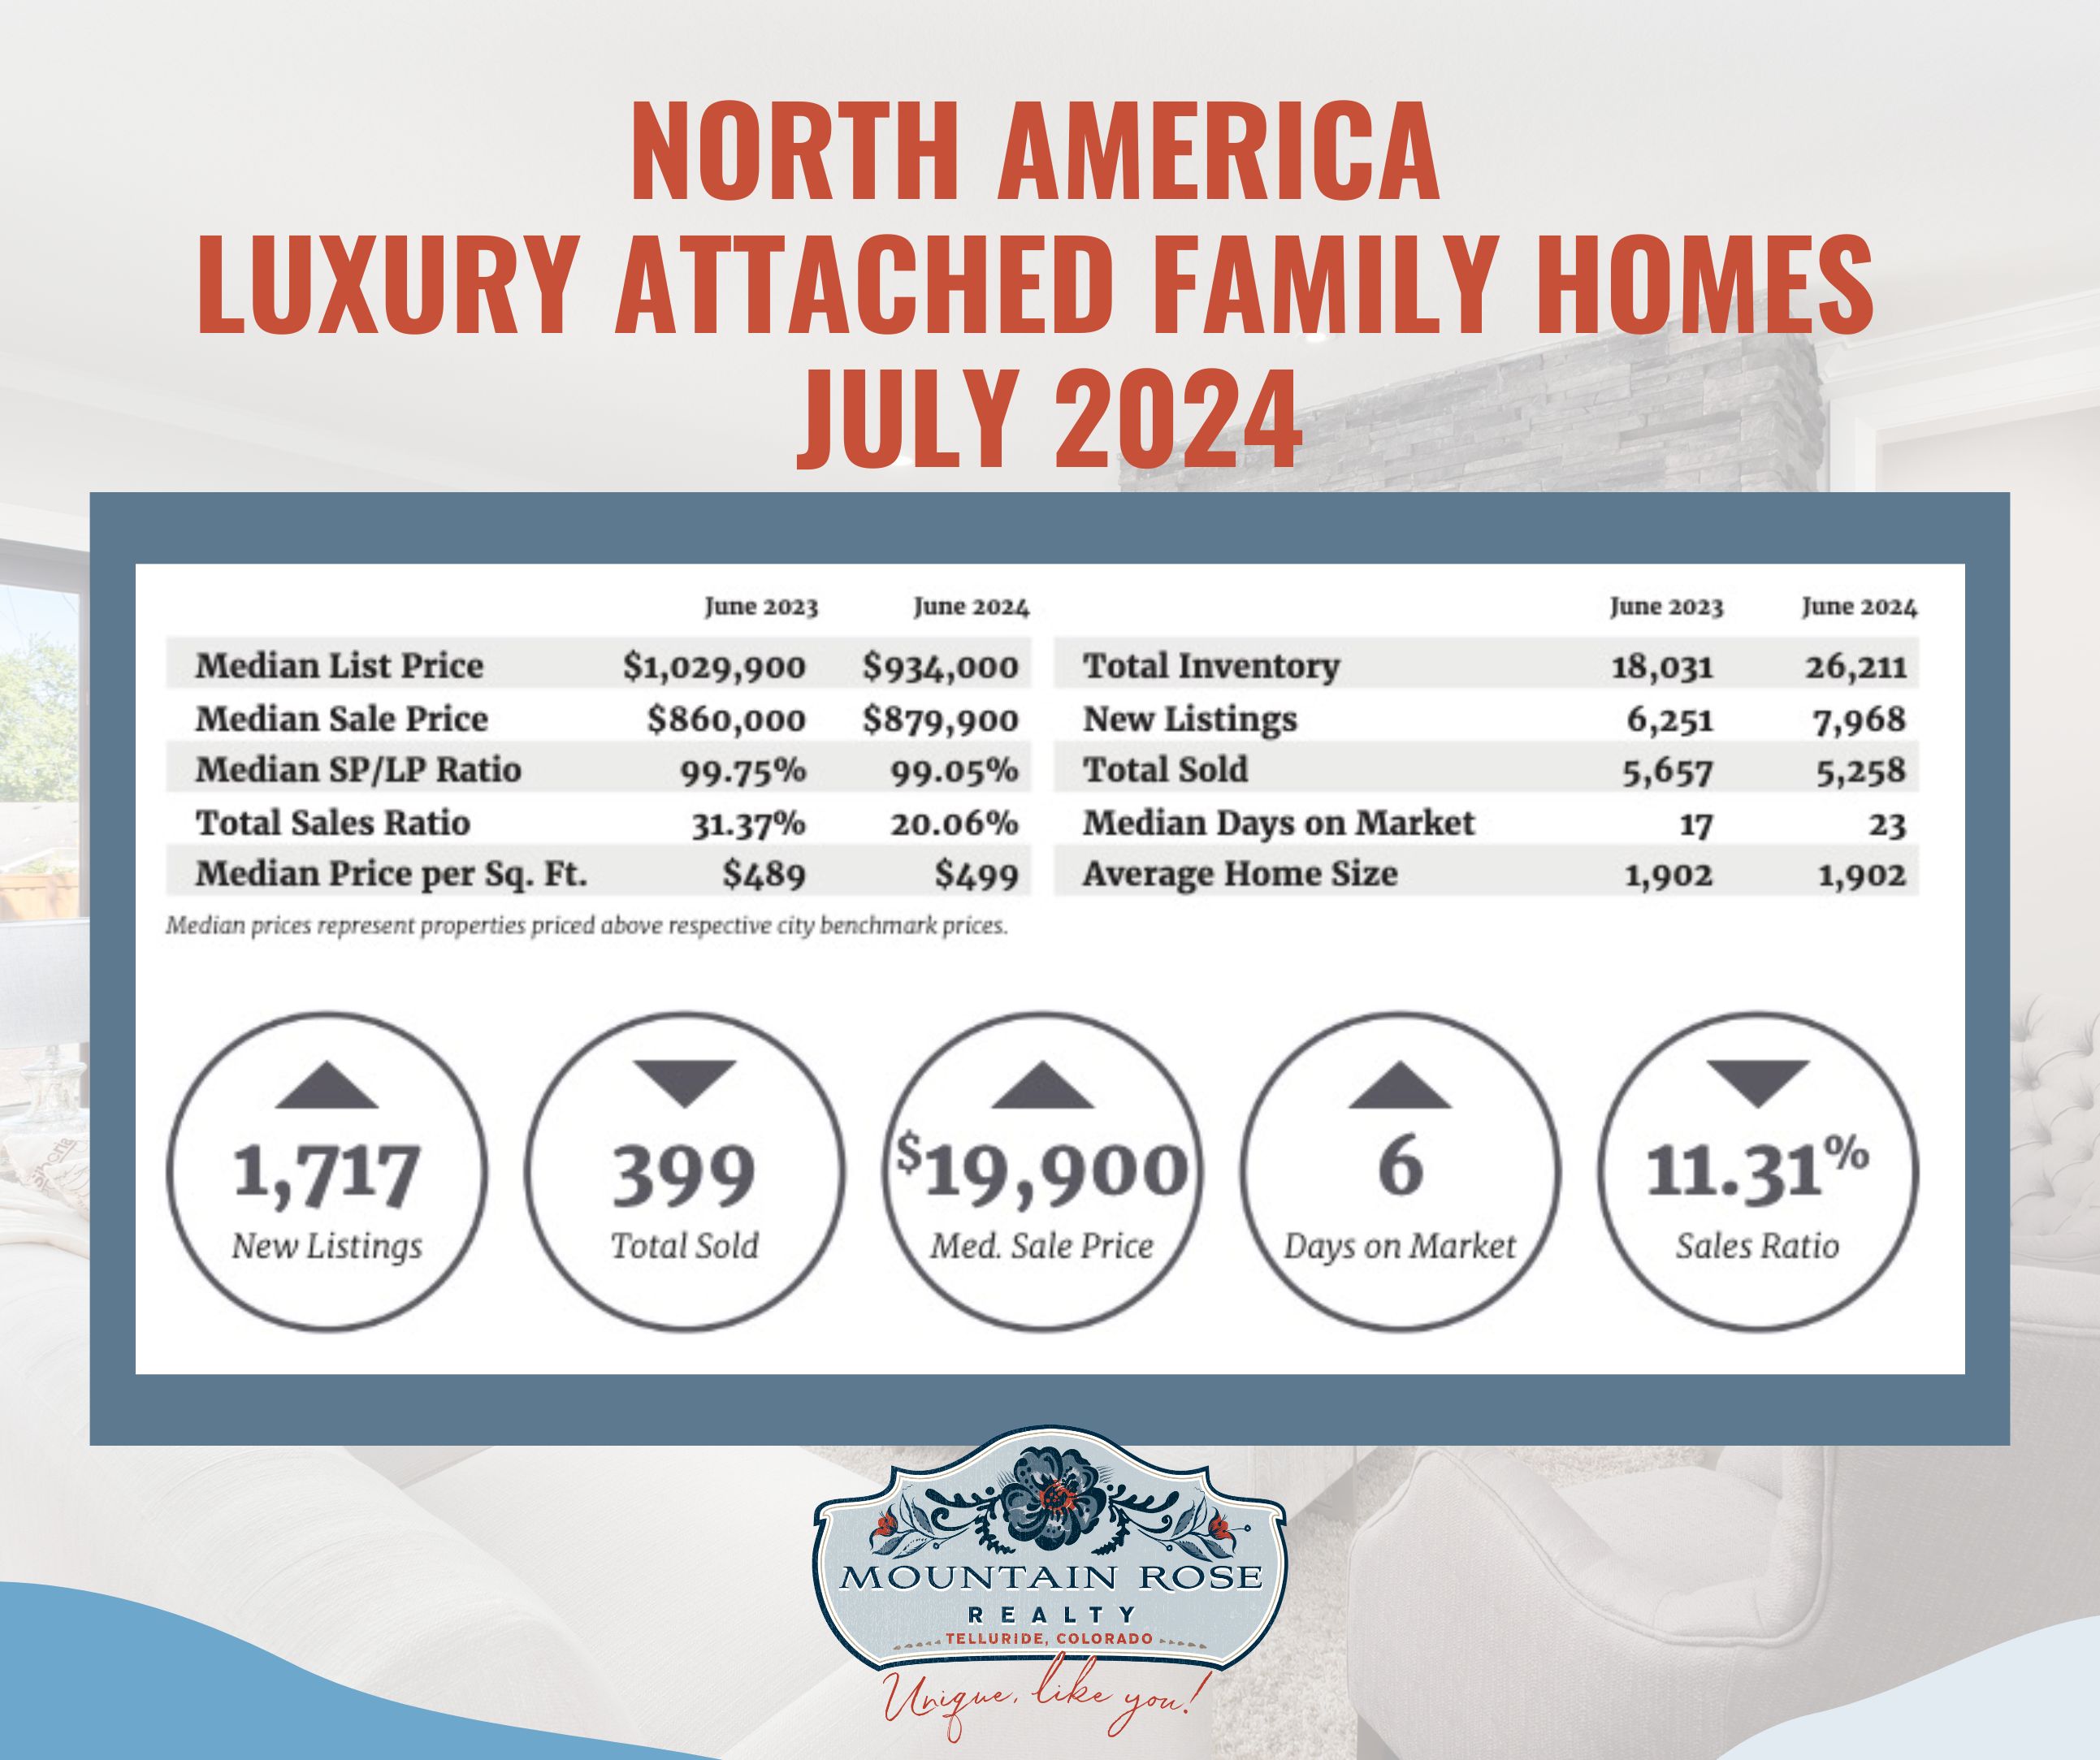
The original attached-home summary reported a balanced category with a 20.06% sales ratio, a $700,000 median luxury threshold and an $879,900 median sale price. The image’s SP/LP row uses a median label for its 99.05% figure.
Named high median sale prices were Manhattan $3,575,000; Whistler $3,337,500; Vail $3,095,000; and the Island of Hawaii $2,500,000. Named sales ratios were Howard County, Maryland 131.7%; Fairfax County, Virginia 129.5%; Arlington and Alexandria, Virginia 101.2%; and Anne Arundel County 91.3%. A sales ratio above 100% is not a sale price above asking; the report’s inventory denominator and timing must be checked before interpreting such a ratio.
The original narrative said 95 of 150 tracked single-family markets favored sellers. That is a statement about the report’s selected markets, not every North American neighborhood. It also described sales rising since January despite a year-over-year decline. The single-family graphic supports the distinct year-over-year comparison: 21,417 sold in June 2023 versus 21,058 in June 2024, while inventory rose from 54,934 to 74,002 and new listings from 20,804 to 25,697. Median days on market rose from 15 to 19. More available homes and fewer sales can coexist with the report’s seller-category label.
Wealth, lifestyle changes, customization, sustainability, technology and inventory were themes in the original commentary. The charts do not measure buyer motives or establish those themes as causes. The claim that inventory remained below traditional norms also requires a defined historical baseline, which this summary does not provide. Use those topics as questions about a particular property’s features, operating costs and competition rather than as a forecast for the remainder of 2024 or today.
These figures concern the report’s selected luxury markets and price bands. A median can change because a different mix of homes sold; it does not measure appreciation of the same property. Report sales ratios are separate from sale-price-to-list-price ratios, and neither guarantees a particular home’s selling time or negotiation outcome. For a present Telluride inquiry, compare recent local transactions, active competition, property condition, location and contract terms. Contact Mountain Rose Realty to discuss that property-specific evidence.