

January 2025 report archive, covering December 2024. The retained North America graphics compare December 2023 with December 2024. The original report was presented by Mountain Rose Realty and Anne-Britt Ostlund. Results below describe those historical report categories, not current market conditions.
The original narrative reported single-family sales up 30.9% and attached sales up 27.55% year-over-year. It reported median sale prices up 1.3% and 3.72%, respectively. Changes in the median of sold homes should not be labeled appreciation of the same properties or evidence that luxury homes hedge other economic risks.
Single-family new listings rose from 8,058 to 9,636 in the chart, consistent with the original rounded 19.6% claim. The attached-home narrative’s 11.7% new-listing claim conflicts with its chart: the image prints 3,305 and 4,028, an increase of 723, or about 21.9%. The table counts and the arithmetic are stated separately from the erroneous original percentage.
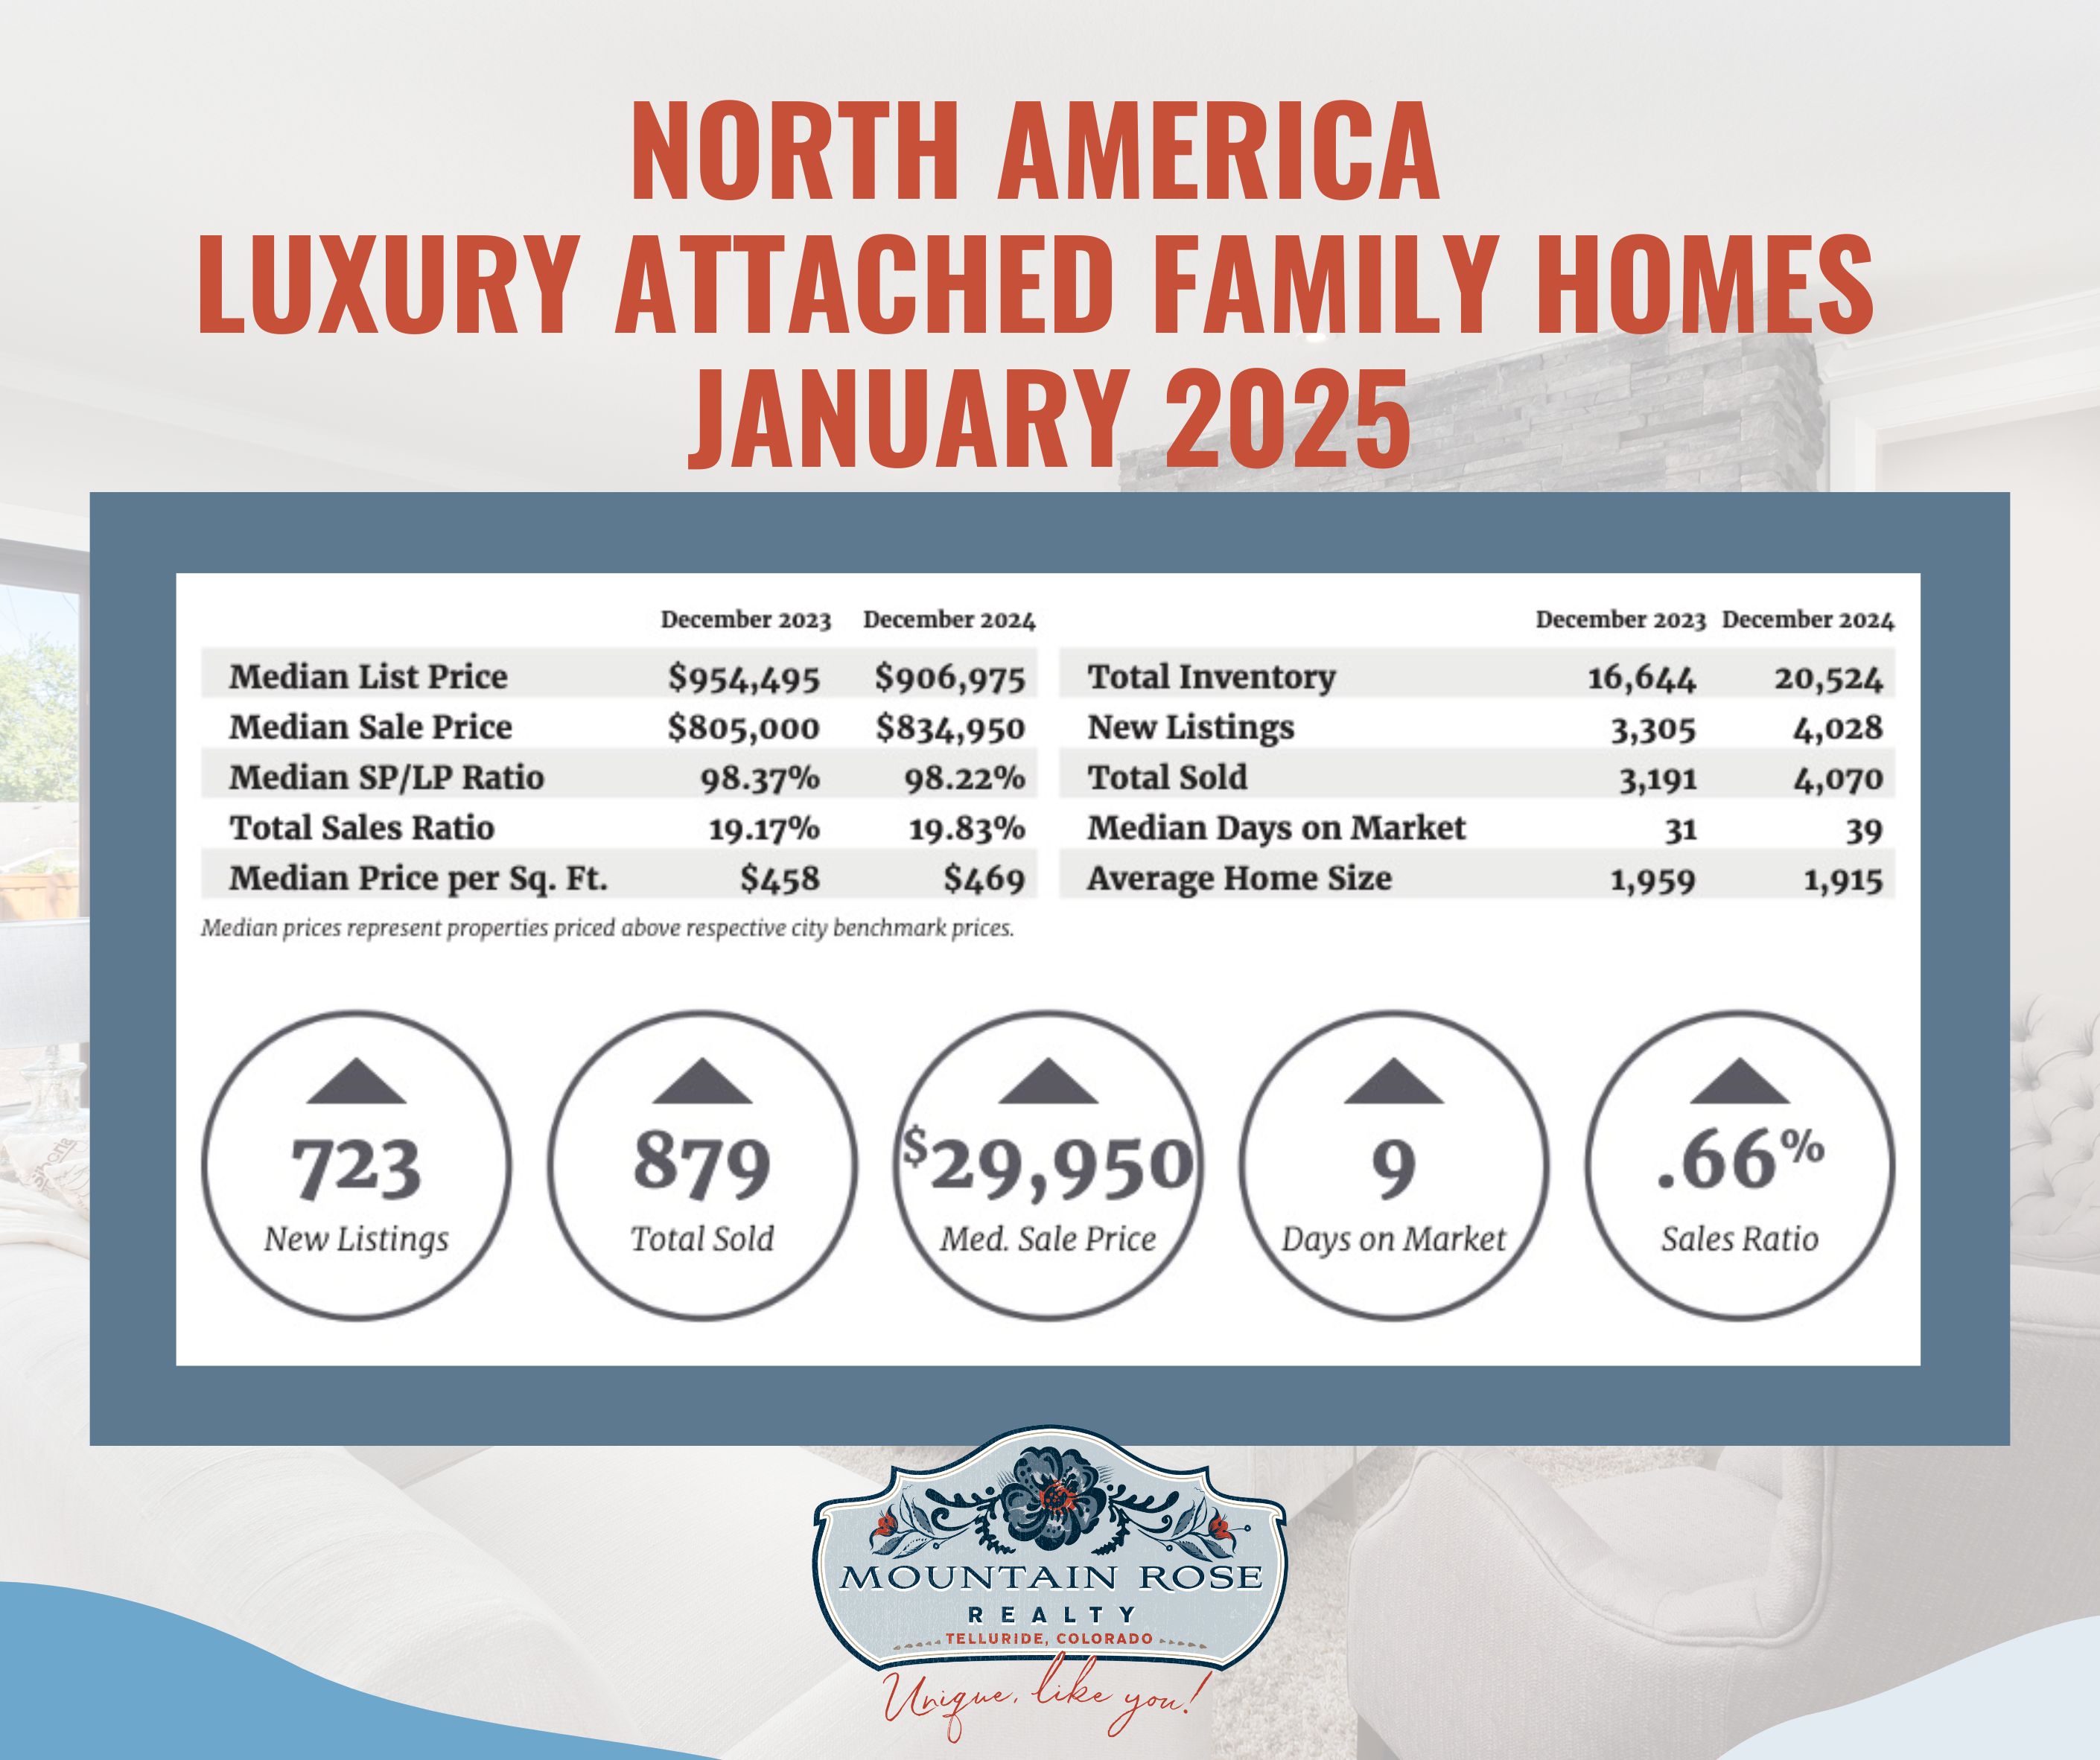
The chart gives a 19.83% sales ratio, a $834,950 median sale price and a 98.22% median SP/LP ratio. The original narrative classified the category as balanced and reported a $675,000 luxury threshold. It called the SP/LP figure an average; the chart’s median label is used here.
The original local comparisons named median sale prices of Whistler $2,620,000; San Francisco $2,300,000; Maui $2,212,500; and Marco Island $2,150,000. Its high sales ratios were Fairfax County 197.8%; Howard County 162.5%; Anne Arundel County 144.0%; and East Bay 126.0%. These are historical summary figures whose local sample details are not shown in the North America image. They do not mean those percentages of asking price or establish how quickly every property sold.
The attached table prints median days on market of 31 and 39, an eight-day increase, while its circular annotation says nine. That internal discrepancy is preserved and identified rather than silently resolved.
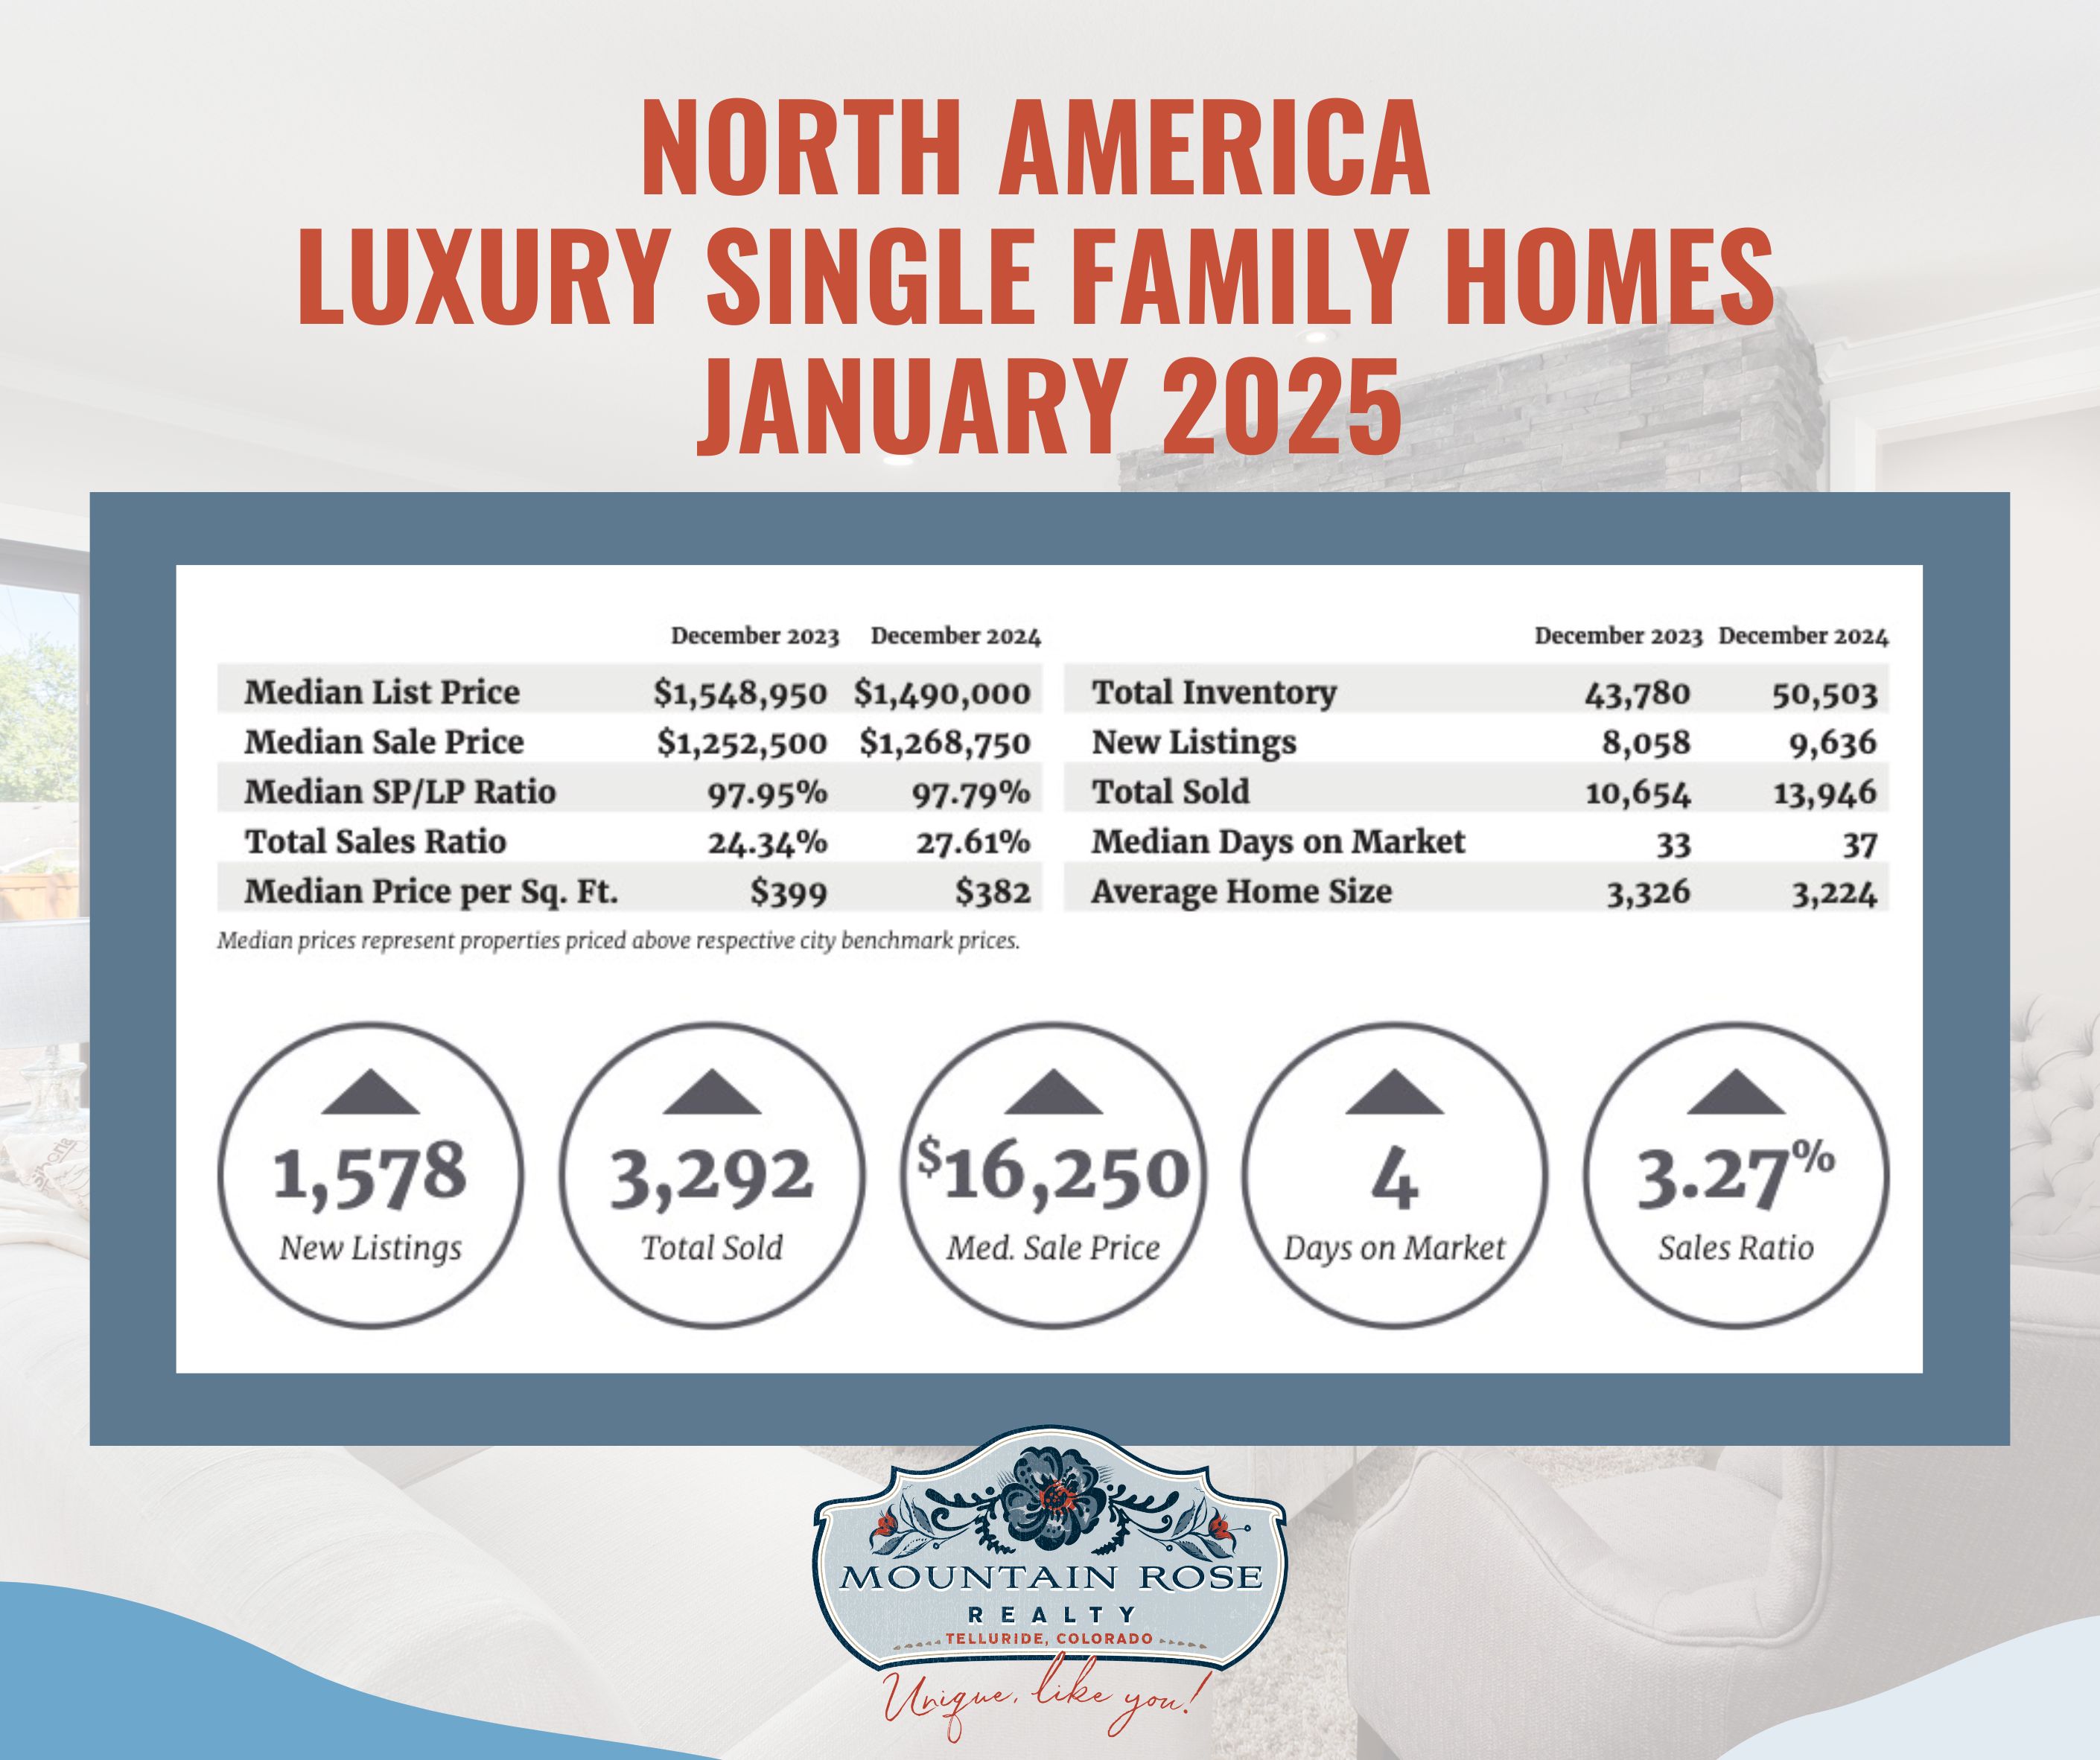
The chart gives a 27.61% sales ratio, a $1,268,750 median sale price and a 97.79% median SP/LP ratio. The original narrative classified the category as seller’s and reported a $900,000 luxury threshold. Its named high median prices were Los Angeles Beach Cities $4,150,000; San Francisco $4,000,000; Paradise Valley $3,925,000; and Naples $3,900,000. Named sales ratios were Baltimore City 166.7%; East Bay 144.2%; Cleveland Suburbs 96.0%; and Silicon Valley 93.0%.
The original discussion raised modern design, sustainable features, tailored amenities, cash purchases and financing choices. These are relevant questions for individual clients, but the charts do not measure universal buyer preferences or show that cash buyers were insulated from market risk. The separate claim that inventory was 30% below pre-pandemic levels lacks a stated baseline, geography and date in the summary and cannot be verified from these two December comparisons.
The article’s expectations for continued strength in 2025 were an outlook at publication, not an established result or a guarantee. Current borrowing costs, available homes and sale outcomes need fresh evidence. An expanding inventory count does not by itself demonstrate stronger demand or better returns.
These figures concern the report’s selected luxury markets and price bands. A median can change because a different mix of homes sold; it does not measure appreciation of the same property. Report sales ratios are separate from sale-price-to-list-price ratios, and neither guarantees a particular home’s selling time or negotiation outcome. For a present Telluride inquiry, compare recent local transactions, active competition, property condition, location and contract terms. Contact Mountain Rose Realty to discuss that property-specific evidence.