

August 2025 report archive, covering July 2025. The original article introduced a 24-page North America edition covering Telluride and other U.S. and Canadian markets. The report link and both original graphics remain below. Each chart compares July 2024 with July 2025.
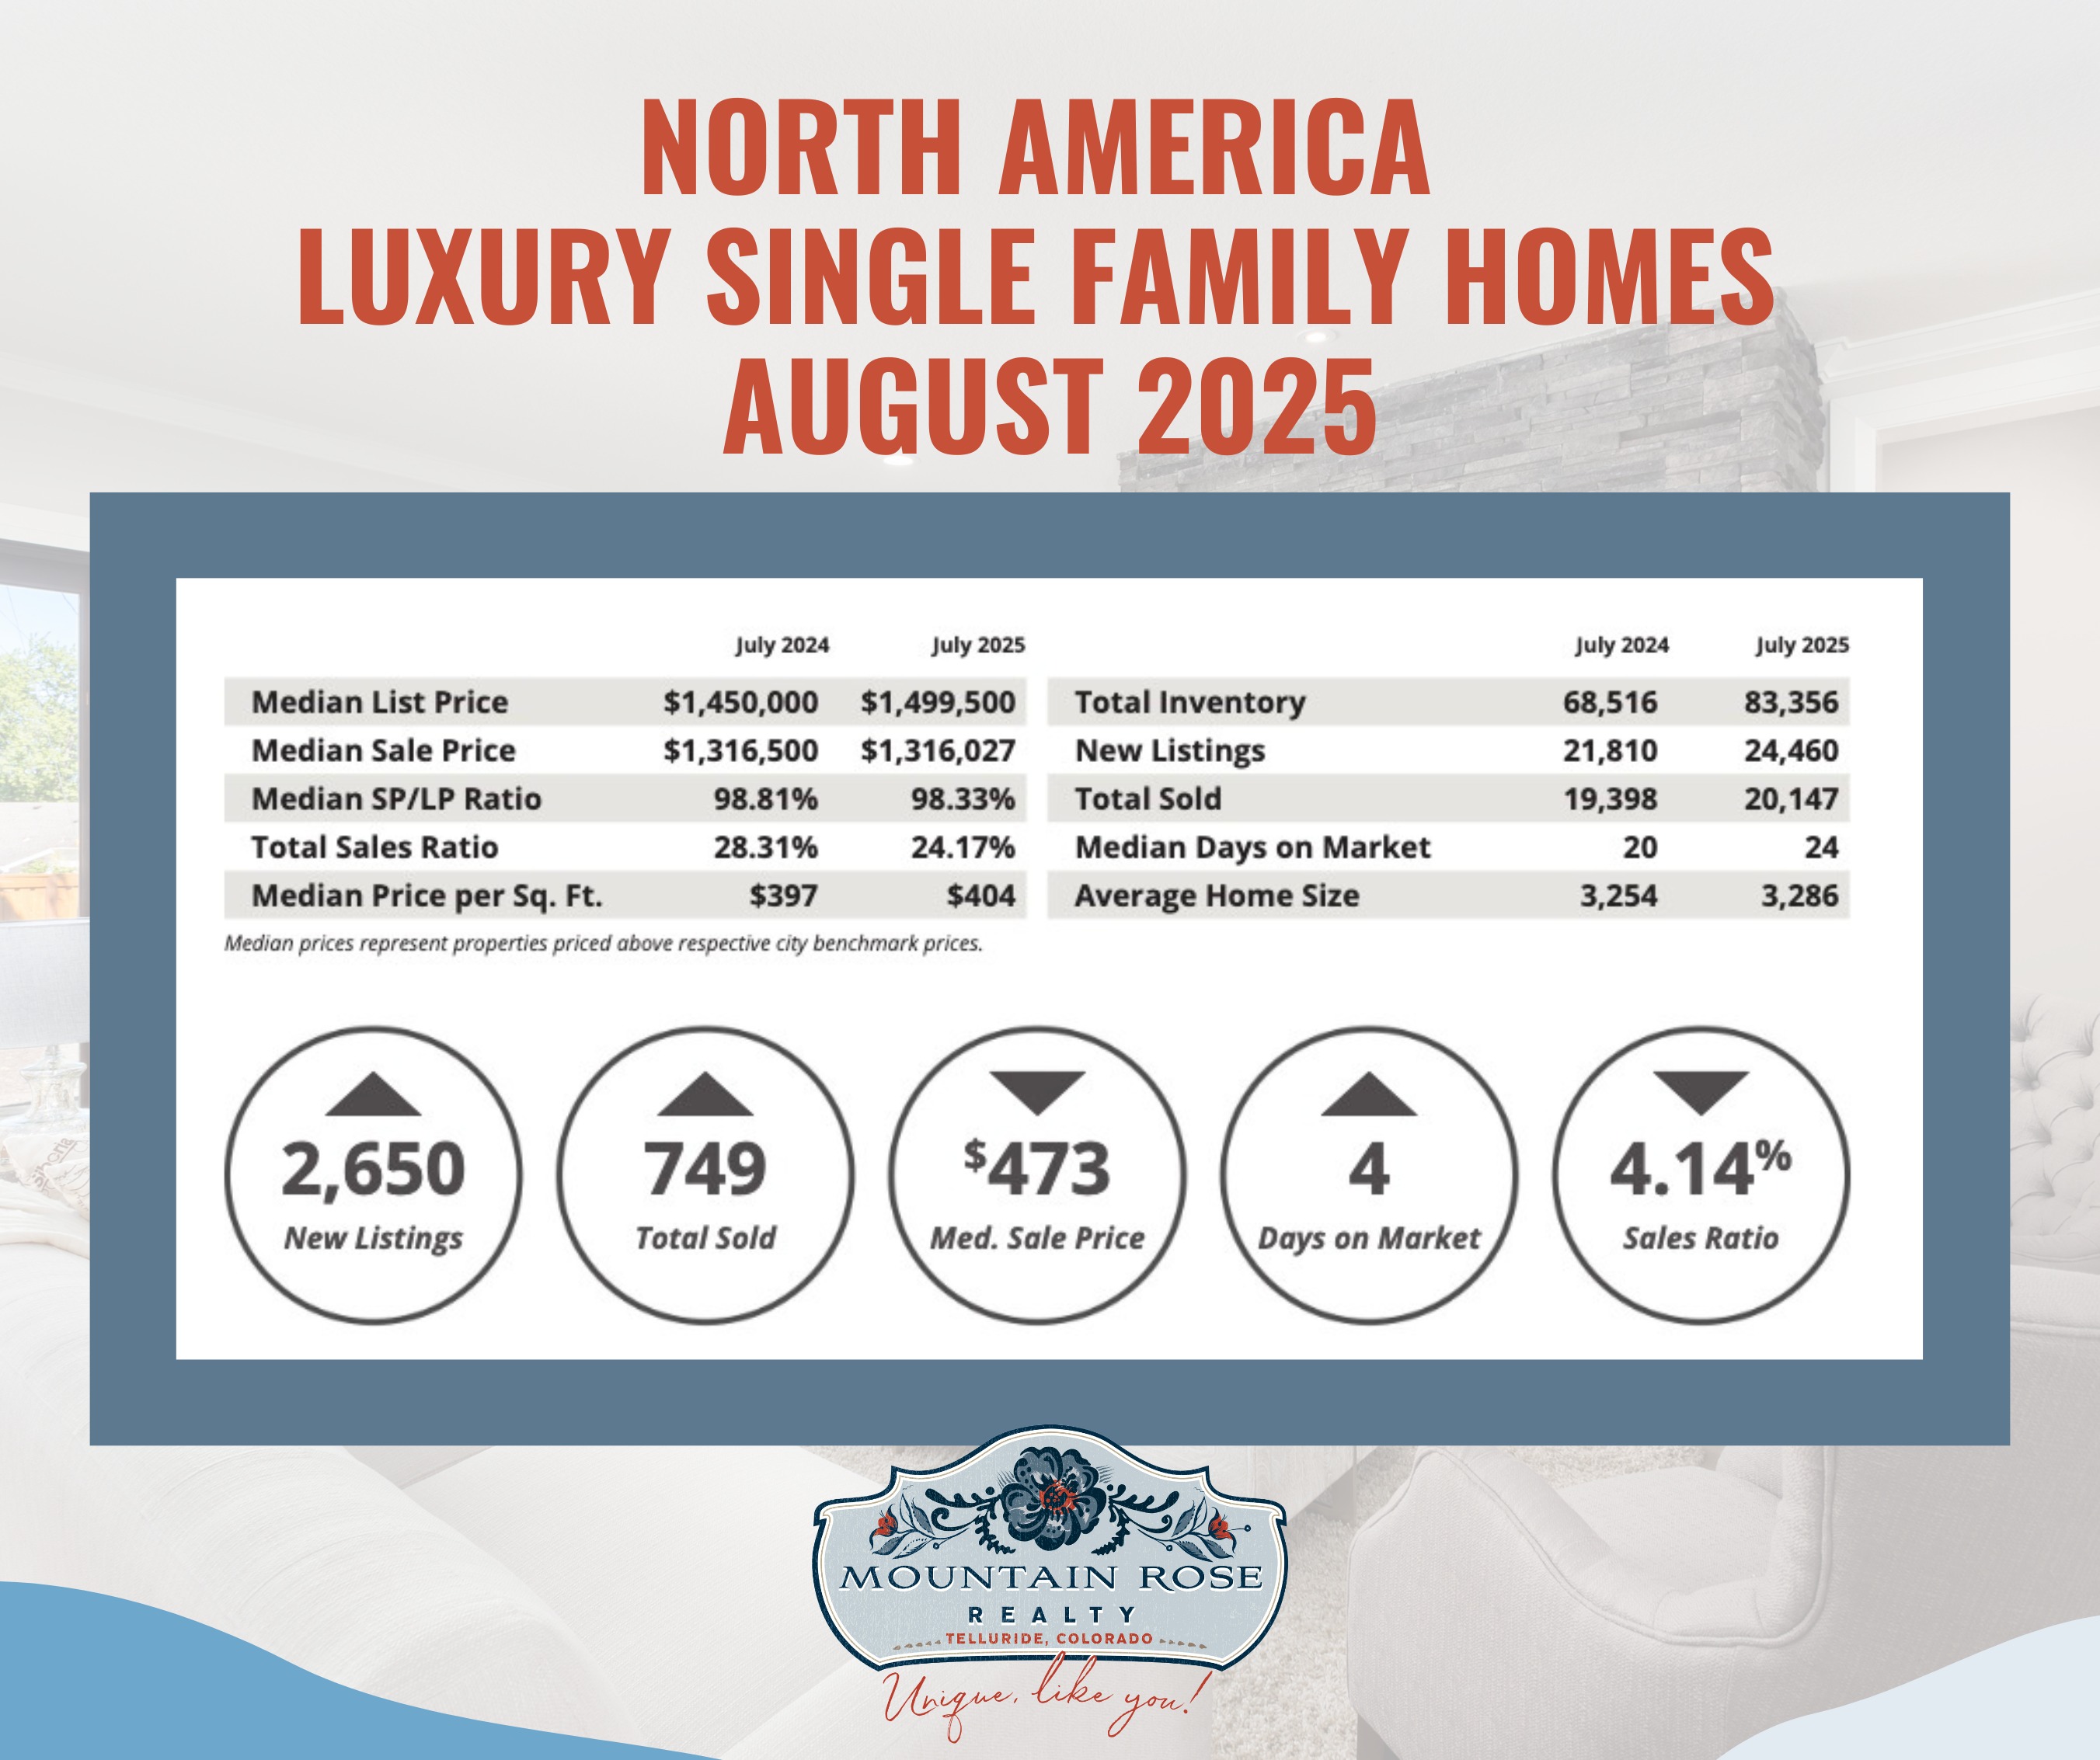
The original narrative reported sales 3.9% above July 2024 and 15.6% above July 2023. The stored table supports the one-year comparison with sold counts of 19,398 and 20,147; it does not contain July 2023 to verify the two-year claim. Inventory is 68,516 and 83,356, consistent with the reported rounded 21.7% increase. New listings are 21,810 and 24,460.
The narrative rounded the median price to $1.3 million. The table gives $1,316,500 and $1,316,027, a decrease of $473. That dollar amount is a change, not a sale price. Median days on market rise from 20 to 24, consistent with the stated 20% increase. Sales ratio falls from 28.31% to 24.17%, while median SP/LP changes from 98.81% to 98.33%. The counts do not prove that particular features preserved value or that buyers deliberately spent longer evaluating homes.

Sold counts fall from 4,951 to 4,495, consistent with the narrative’s rounded 9.2% decline. Inventory rises from 23,627 to 27,482, about 16.3%. New listings are 7,209 and 7,230. Although the narrative said new listings slowed sharply, these two columns show a small year-over-year increase; a separate monthly trend would require additional data.
Median sale price changes from $879,500 to $874,000, a decrease of $5,500, and median days on market rise from 22 to 34. Sales ratio changes from 20.95% to 16.36%; median SP/LP from 99.13% to 98.34%. The original rounded 98.3% sold-to-list reference is consistent with the charts’ 2025 median rows, not proof that every well-presented property sold near asking. Category ratios and individual negotiating conditions are different questions.
The article also attributed a 2.7% rise in prices for the top 10% of homes, alongside inventory growth of up to 35% in some regions, to Zillow. It did not provide a source link, measurement period, named regions or the definition of the price measure. Those figures are retained as an unresolved original attribution and cannot be combined with these July report tables as if they were the same dataset.
The original commentary emphasized design, sustainability, amenities, privacy, presentation and lifestyle fit. Discuss those features in a particular home, their condition and ongoing costs, and whether relevant comparables support a pricing adjustment. The charts do not survey buyer preferences or guarantee long-term value, security or a premium for particular features.
Digital tours, analytical tools and marketing can help organize information and reach potential buyers, but their effectiveness depends on the assignment and implementation. Ask for the proposed service and the evidence behind recommendations. The original outlook of continued “equilibrium” for the rest of 2025 was commentary at publication, not a confirmed future outcome.
Report categories and medians describe groups of transactions. They do not measure appreciation of the same homes, establish why buyers acted or determine a particular property’s value. Sales ratio is distinct from sale-price-to-list-price ratio; the inventory denominator and timing matter when interpreting it. Compare recent local sales, active listings, condition, access, location and contract terms for a present decision. Contact Mountain Rose Realty to discuss the evidence for your property and plans.