

September 2025 report archive, covering August 2025. Both original graphics compare August 2024 with August 2025 for North America luxury categories. The original 24-page report link is retained. Two statistics previously placed in the Telluride section actually belong to the North America single-family table.
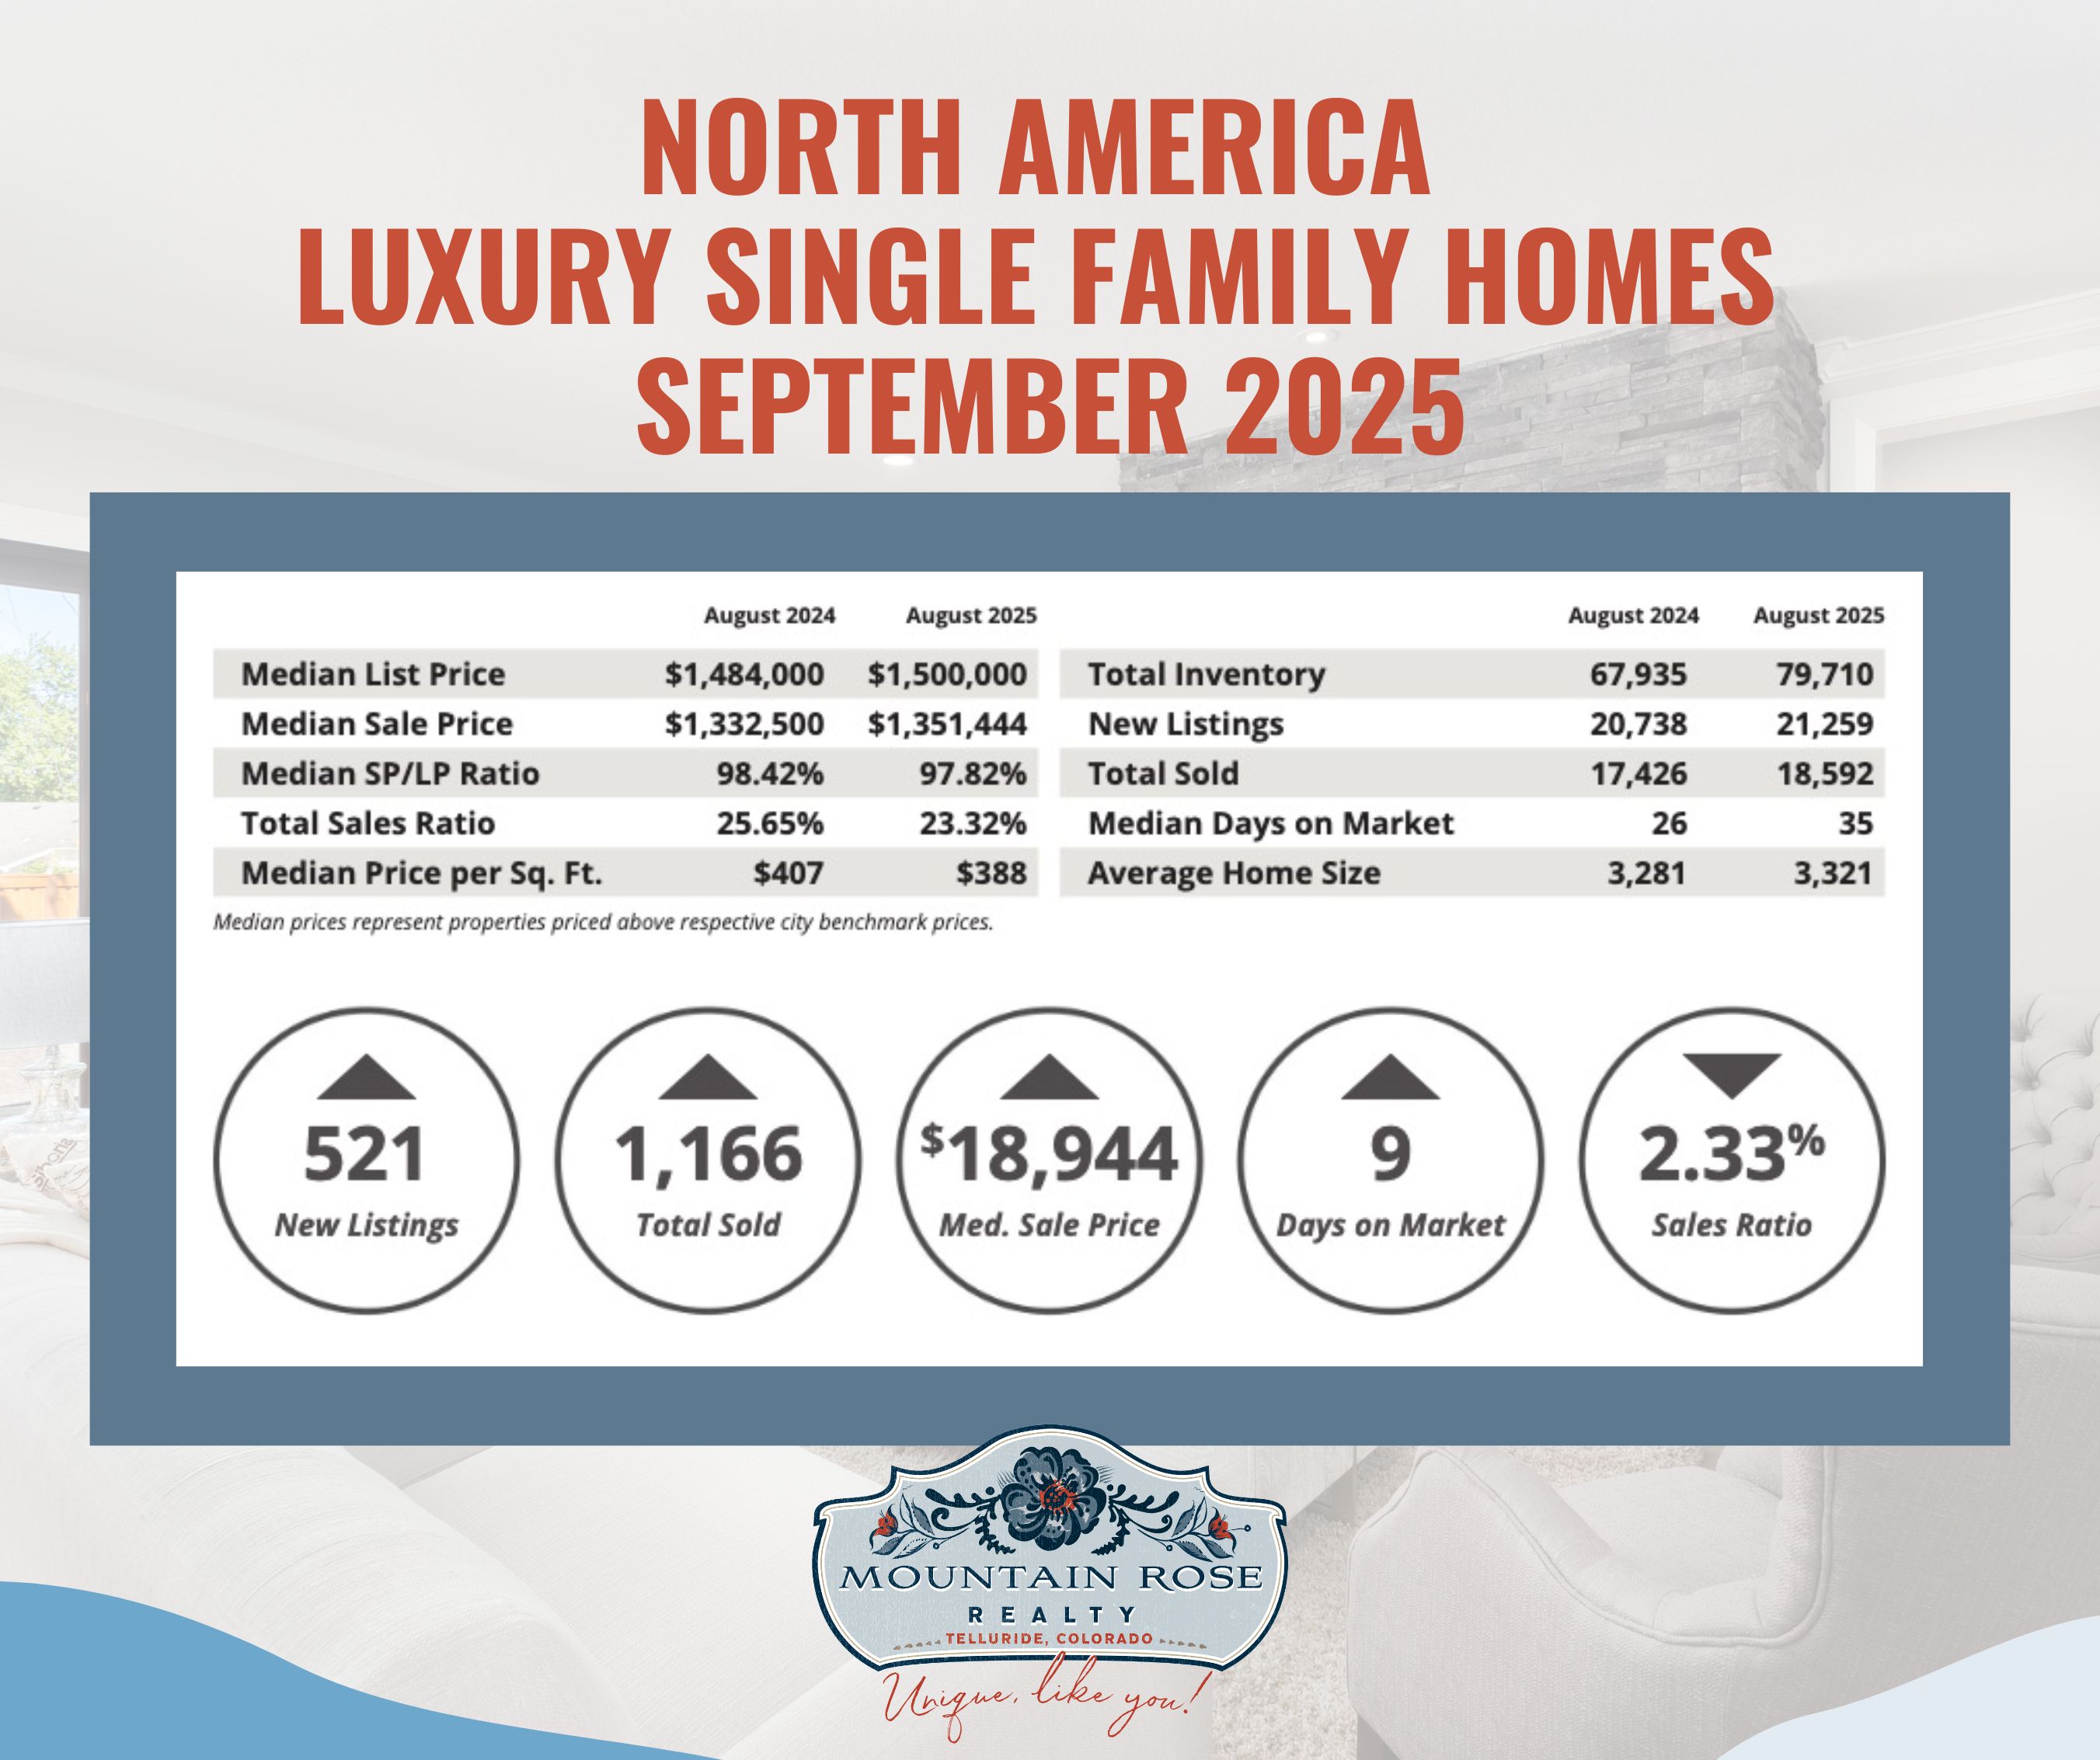
Total sold rises from 17,426 to 18,592, consistent with the original rounded 6.7% year-over-year increase. New listings rise from 20,738 to 21,259, about 2.5%. The article contrasted that growth rate with July’s reported 12.1%; the August graphic itself does not contain July’s comparison.
The August 2025 North America sales ratio is 23.32%, and median SP/LP is 97.82%. Those are not Telluride-specific measures. The original wording “Average Sales Price: 97.82% of list price” has been corrected: it is a median price-to-list ratio, not a dollar sale price. The table also prints median sale price of $1,351,444, inventory of 79,710 and median days on market of 35, compared with $1,332,500, 67,935 and 26 in August 2024.

Total sold changes from 4,539 to 4,519, approximately 0.4% lower, while new listings change from 6,528 to 6,588, approximately 0.9% higher. This supports the original description of new-listing growth under 1%.
The original narrative said inventory rose 17.3%, but the stored table prints 23,031 and 26,377, an increase of about 14.5%. The difference is identified rather than silently treating the original percentage as verified. Median sale price falls from $922,250 to $895,500; sales ratio from 19.71% to 17.13%; and median SP/LP from 98.53% to 98.36%. Median days on market rise from 27 to 40.
The original summary reported a Telluride luxury median sale price of $8,425,000 and compared it with Pitkin County $7.85 million, Los Angeles Beach Cities $4.35 million and Whistler $4 million. These remain dated, attributed summary figures. The retained North America images do not show those local samples or verify a universal ranking. In particular, the 23.32% sales ratio and 97.82% median SP/LP cannot be carried over from the North America chart to label Telluride a seller’s market.
The article discussed mortgage rates, seller timing, sustainability, smart-home features, turnkey condition and convenience. The charts do not measure generational preferences, seller patience or the premium caused by a feature. A rate change can affect a financing scenario, but it does not alone predict which buyers will transact or what will happen the next month.
Use those themes to ask concrete questions: which features does this household need, what does the property actually offer, what are the carrying costs, and which comparable sales support the price? The original September outlook should remain an outlook made in 2025 rather than present advice.
Report categories and medians describe groups of transactions. They do not measure appreciation of the same homes, establish why buyers acted or determine a particular property’s value. Sales ratio is distinct from sale-price-to-list-price ratio; the inventory denominator and timing matter when interpreting it. Compare recent local sales, active listings, condition, access, location and contract terms for a present decision. Contact Mountain Rose Realty to discuss the evidence for your property and plans.