
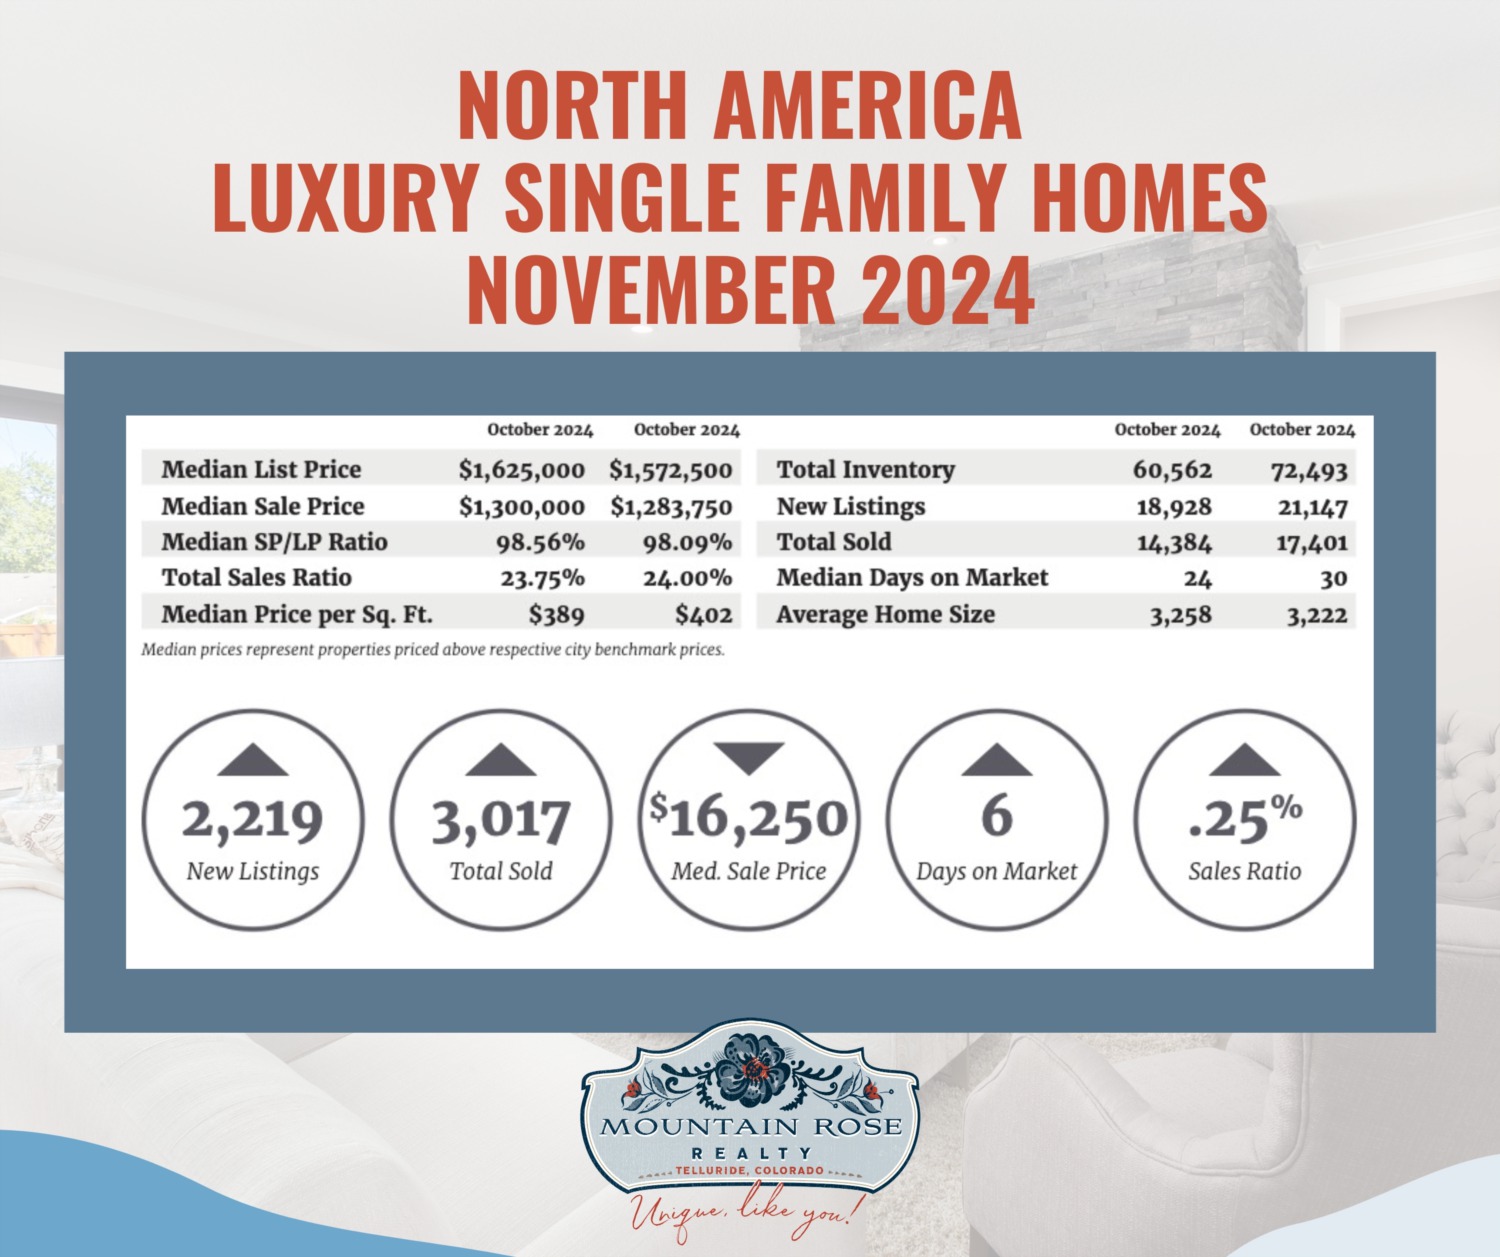
November 2024 report archive. This edition’s two stored graphics label both comparison columns October 2024. That apparent source-label error remains unresolved. The original 24-page report link, images and useful historical summary figures are preserved, without inventing a different date for either column.
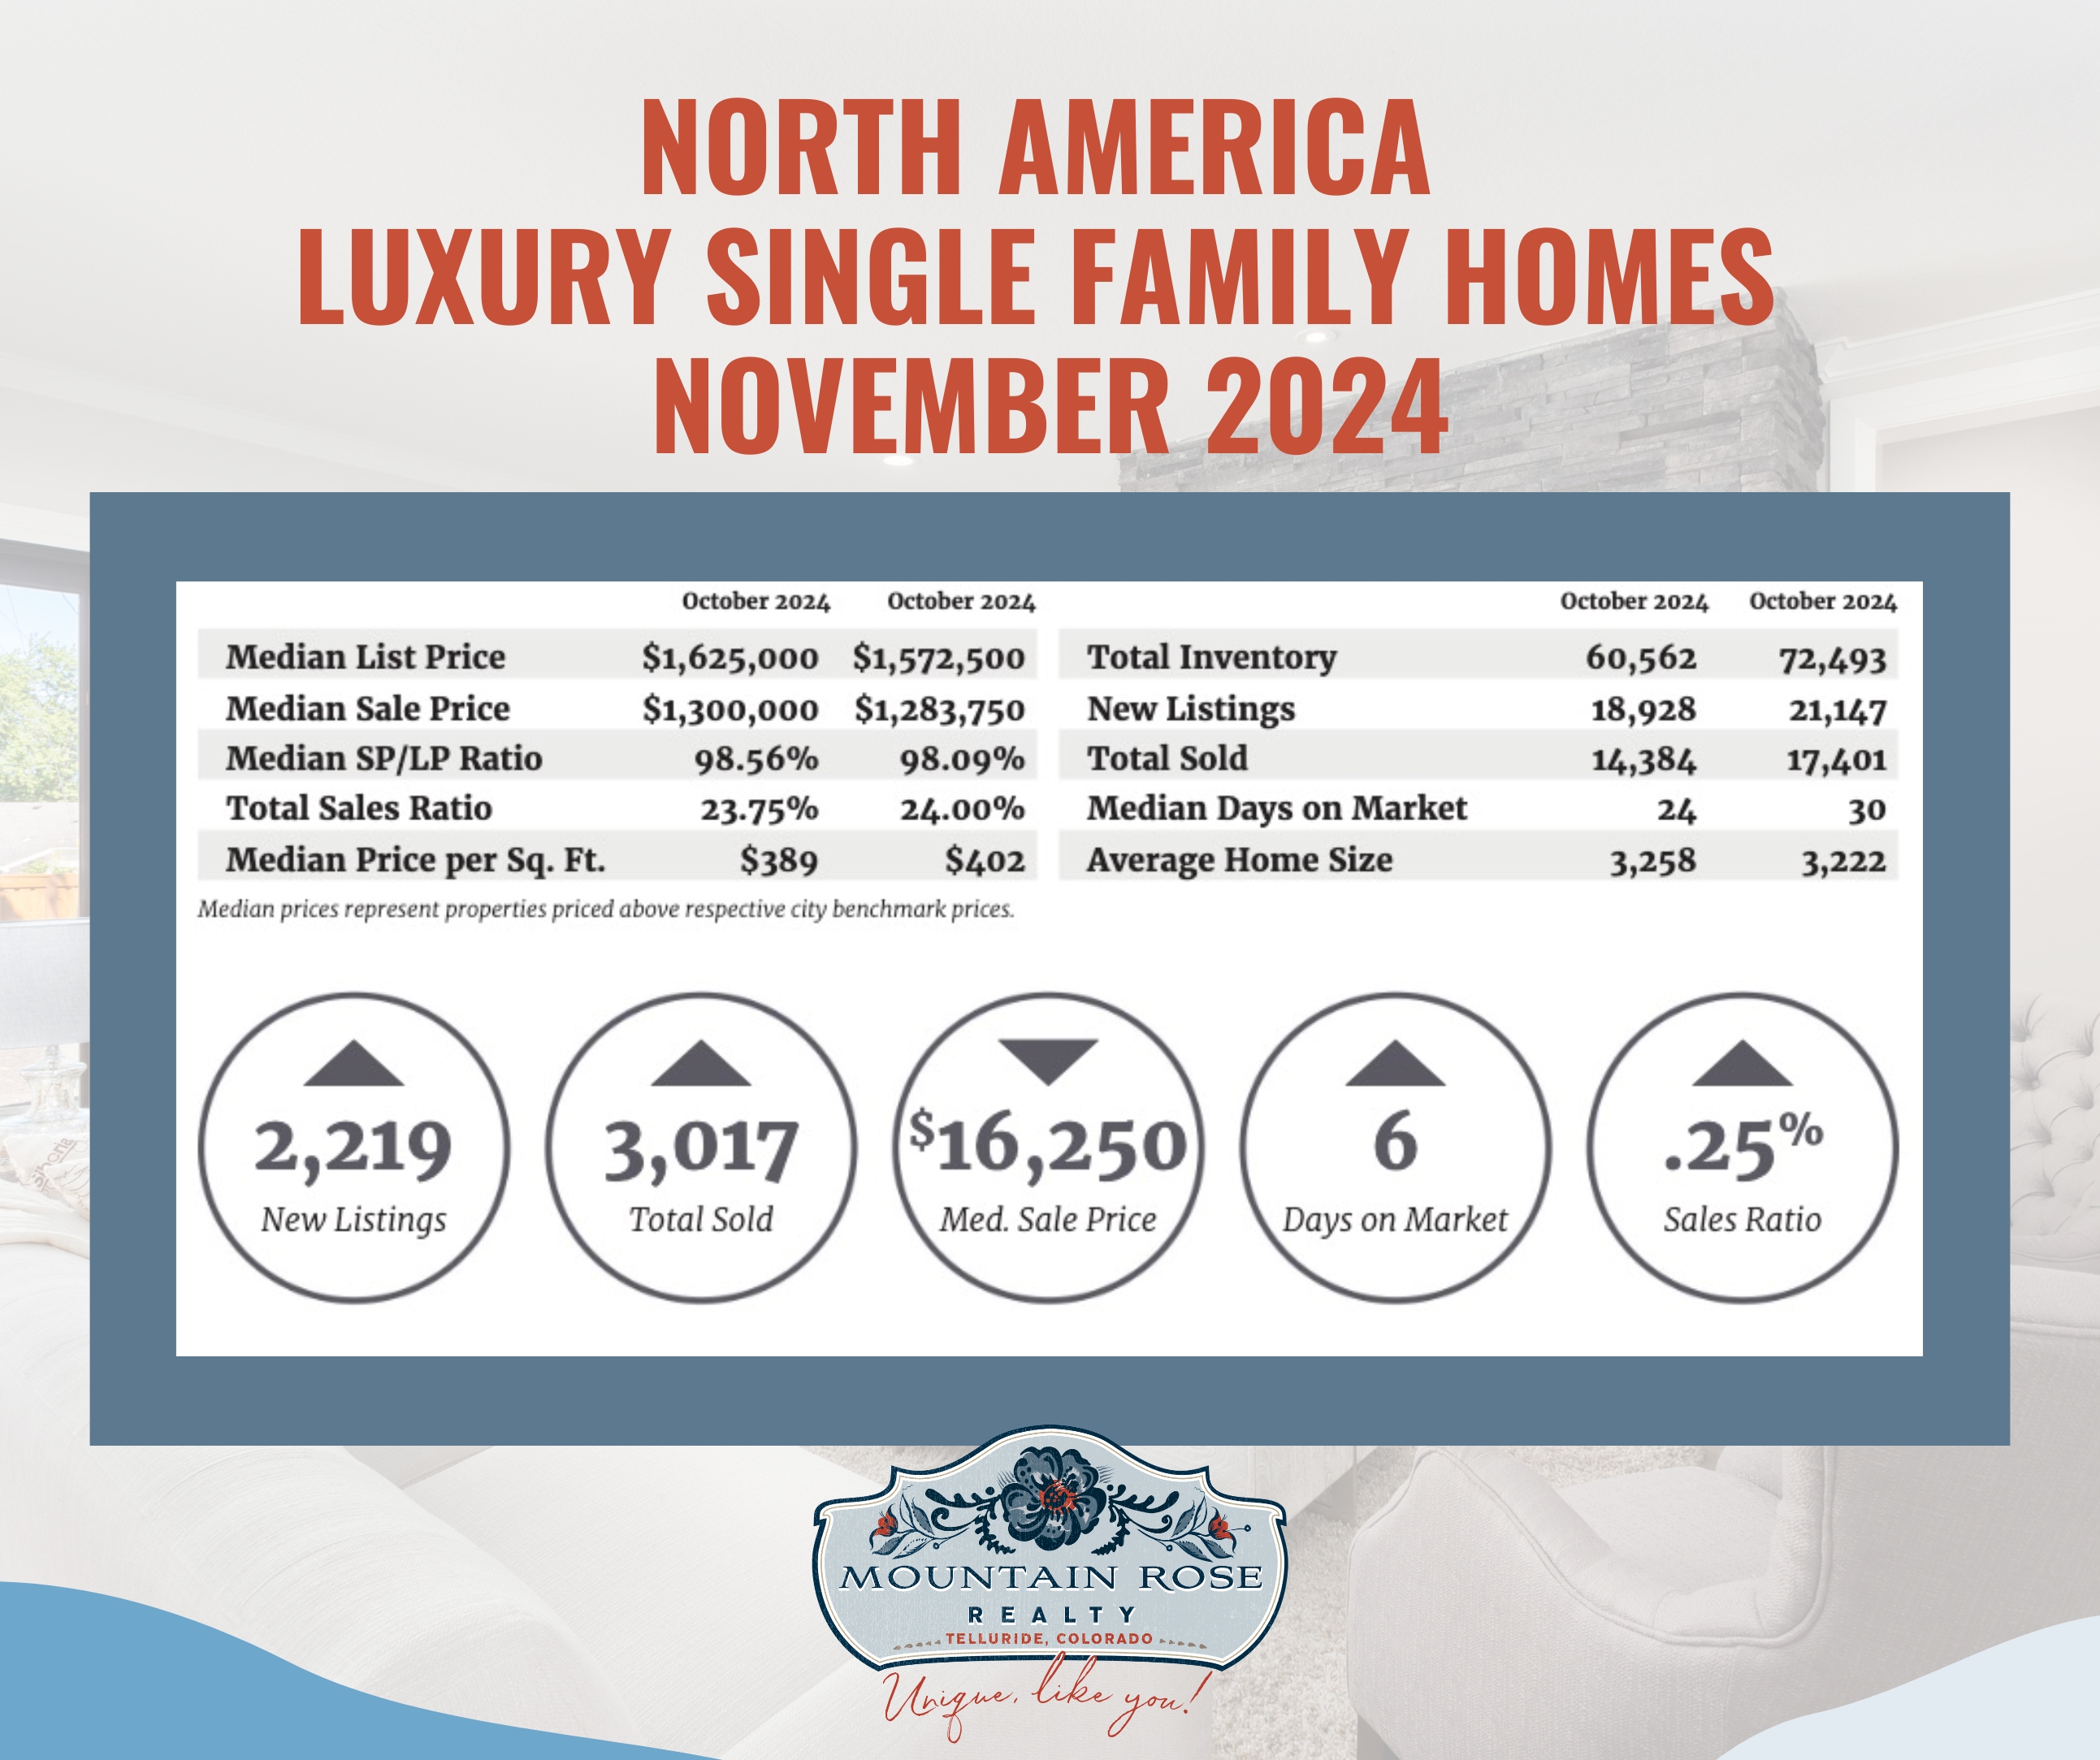
The right-hand column prints a 24.00% sales ratio, a $1,283,750 median sale price and a 98.09% median SP/LP ratio. The original narrative classified the category as seller’s and reported a $900,000 median luxury threshold. Its “average” SP/LP wording has been corrected to the chart’s median label. November is the edition date; the graphic does not identify November sales.
The original named median sale prices were Telluride $7,197,500; Fort Lauderdale $4,000,000; Park City $4,000,000; and San Francisco $3,900,000. Named sales ratios were Baltimore City 130.8% and East Bay 87.6%. Those local figures come from the original summary; the North America chart does not display their sample sizes. A Baltimore or East Bay ratio cannot establish demand or likely offers for a Telluride listing.
The left and right columns print 14,384 and 17,401 total sold, 18,928 and 21,147 new listings, and median sale prices of $1,300,000 and $1,283,750. Their numerical differences can be read from the image, but the duplicated dates prevent a reliable year-over-year interpretation. The circles represent differences between columns, not actual median prices.

The right-hand column prints an 18.51% sales ratio, a $902,750 median sale price and a 98.72% median SP/LP ratio. The original narrative classified the category as balanced and reported a $700,000 median luxury threshold. Its named high median prices were Telluride $3,300,000; Naples $2,750,000; Sarasota and Beaches $2,550,000; and Whistler $2,300,000.
Named sales ratios were Anne Arundel County 127.0%; Howard County 118.4%; Fairfax County 109.7%; and McLean and Vienna 95.5%. The original summary described ratios above 100% through sales and an inventory snapshot. Verify the publisher’s denominator and timing before interpreting these as turnover measures; they are not prices above asking.
The attached chart prints left and right median sale prices of $882,500 and $902,750, total sold of 4,181 and 4,607, new listings of 6,795 and 7,344, and median days on market of 21 and 29. Both columns again say October 2024. The $20,250 circle is a difference between medians, not the price of an attached home.
The report’s seller and balanced labels summarize its historical ratio framework. They do not promise favorable negotiations, reliable top-value offers or an ideal time for everyone to buy or sell. High local medians can reflect the mix and small number of homes sold; they do not measure a community’s “unparalleled value” or the appreciation of a particular property.
Report categories and medians describe groups of transactions. They do not measure appreciation of the same homes, establish why buyers acted or determine a particular property’s value. Sales ratio is distinct from sale-price-to-list-price ratio; the inventory denominator and timing matter when interpreting it. Compare recent local sales, active listings, condition, access, location and contract terms for a present decision. Contact Mountain Rose Realty to discuss the evidence for your property and plans.