

The August 2024 edition reports July 2024 results. Its Telluride summaries and its broader North American charts describe different samples. The two original body graphics below are explicitly North American comparisons; they are not charts of Telluride alone.
Open the original 22-page luxury report for its category definitions, tables and North American comparisons.
These measures describe the homes and inventory in that month’s luxury sample. A shorter median time on market does not, on its own, establish rising demand throughout Telluride or guarantee a similar result for a new listing.
The attached-home median time increased by 37 days. That is a different direction from the single-family comparison, and neither segment’s sales ratio measures an individual seller’s investment return.
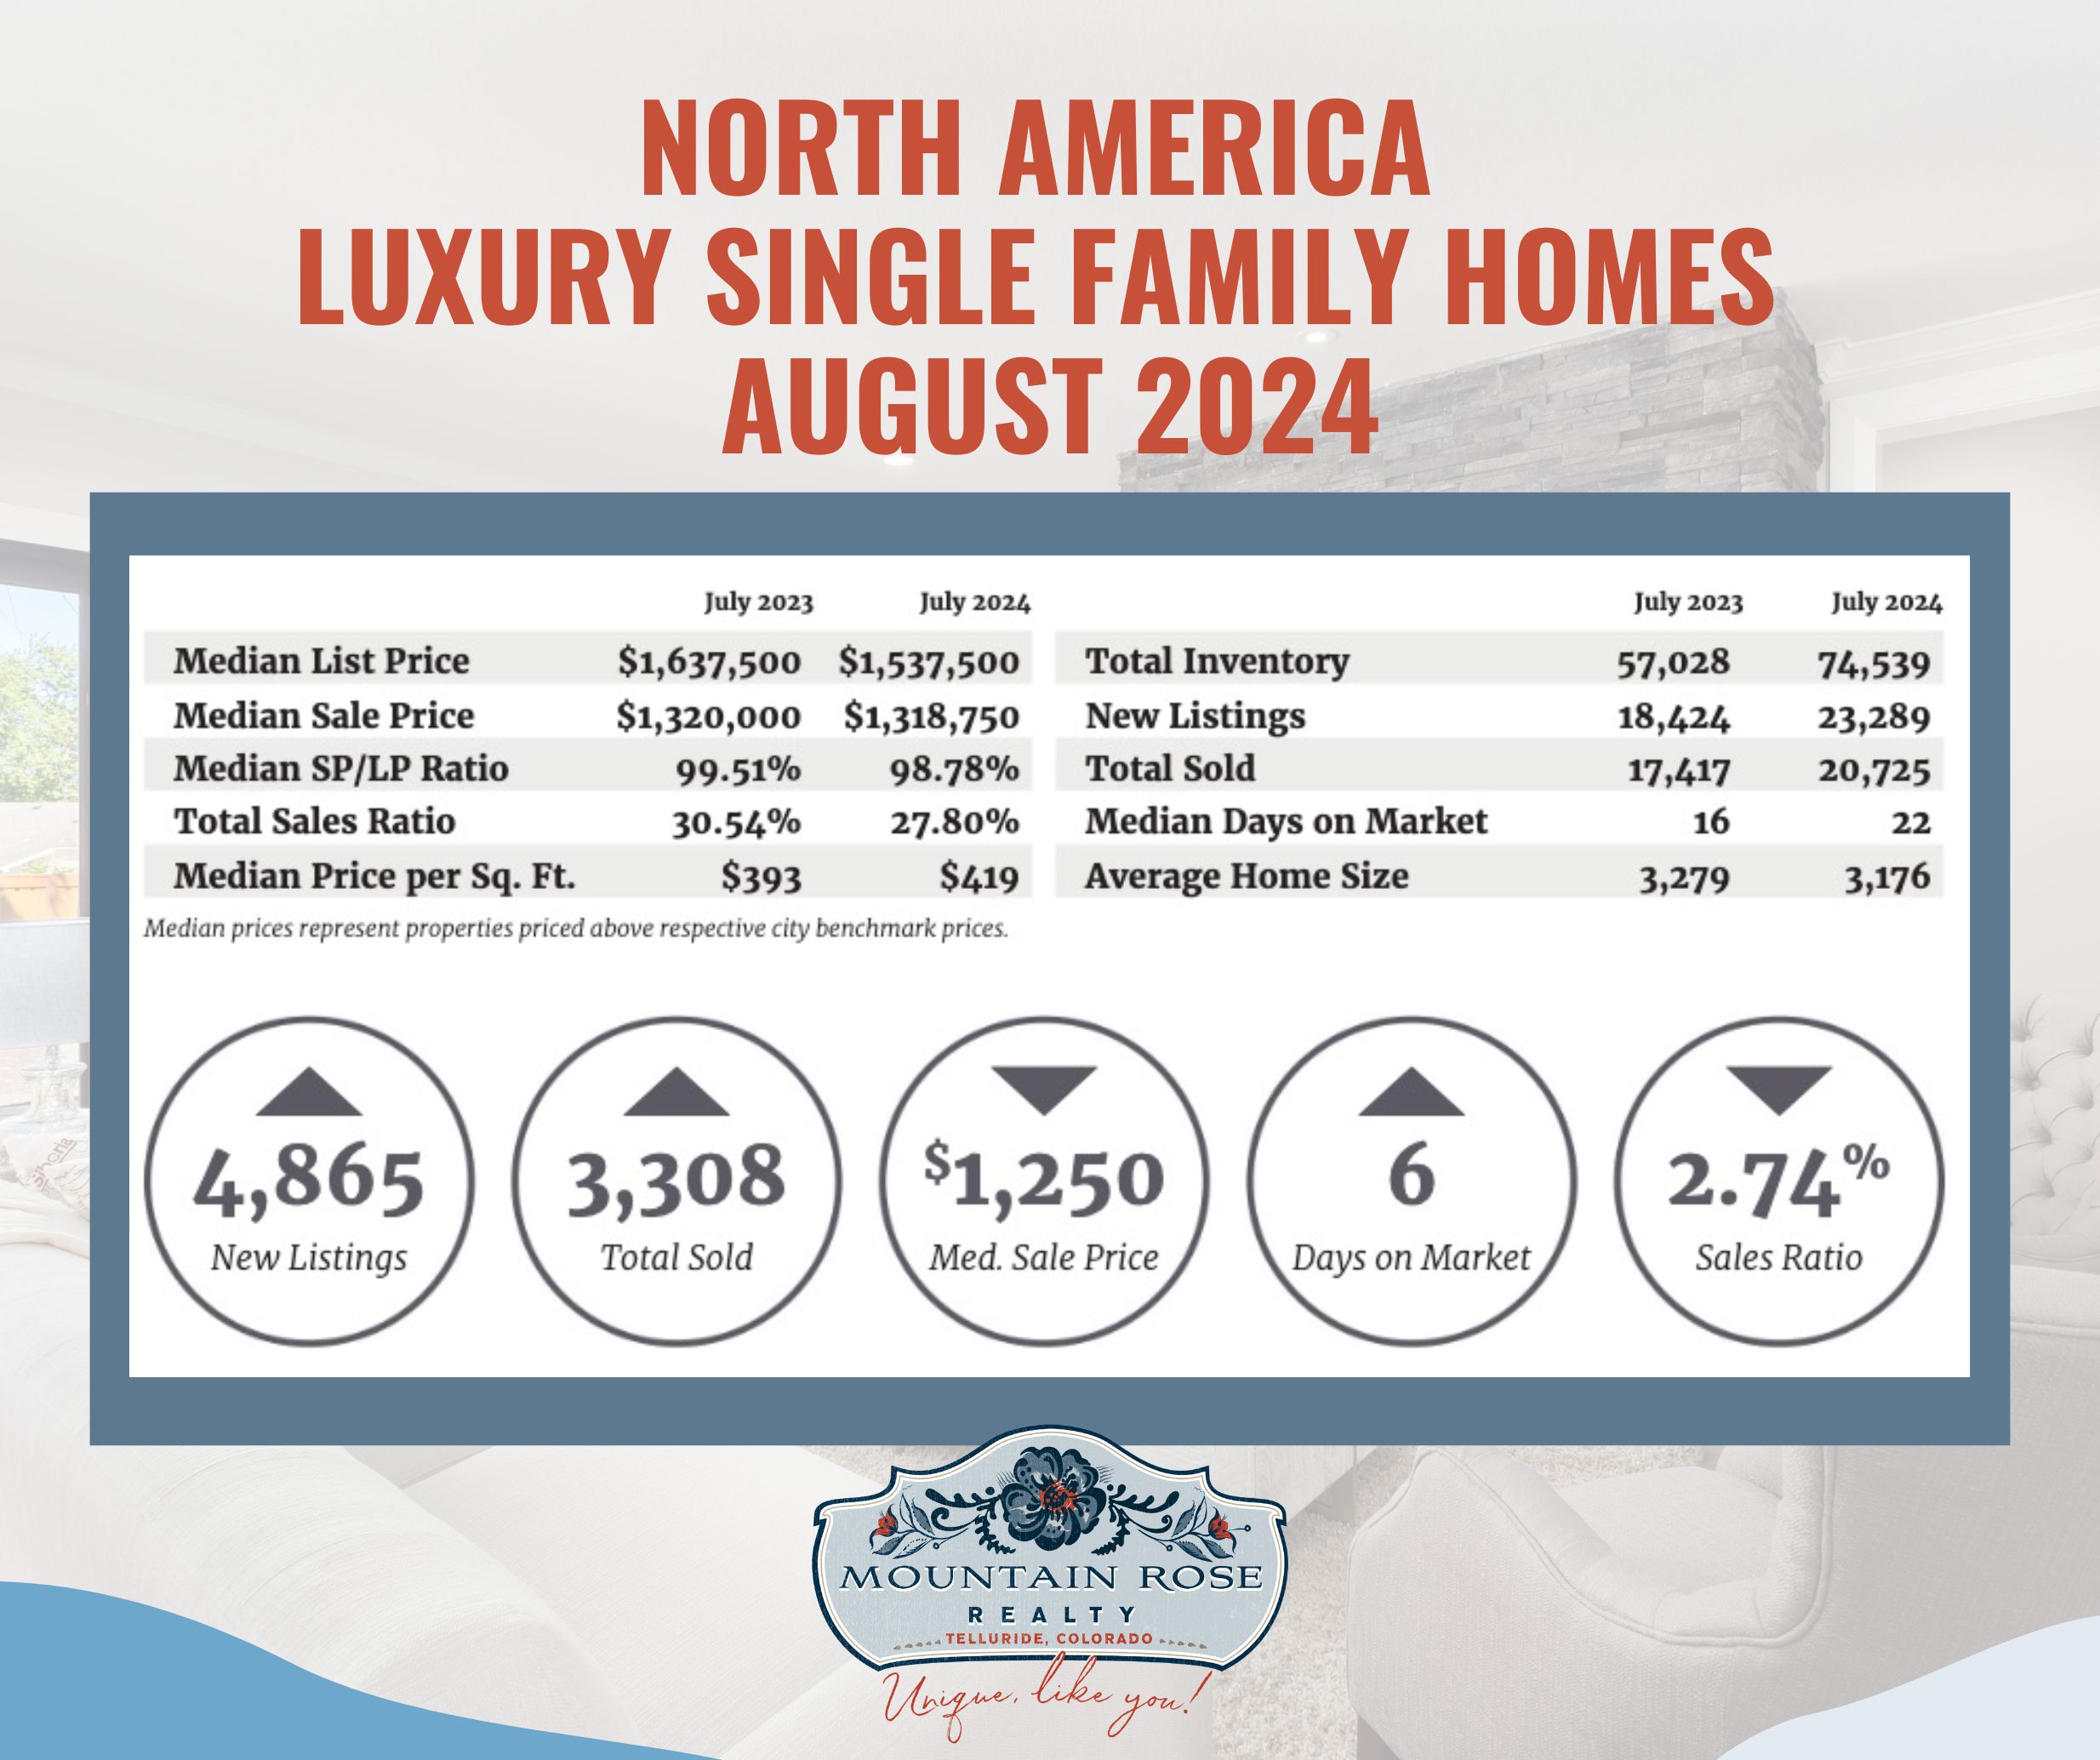
The retained single-family graphic compares July 2023 with July 2024 across the report’s North American sample. It shows median list price of $1,637,500 versus $1,537,500; median sale price of $1,320,000 versus $1,318,750; median sale-to-list ratio of 99.51% versus 98.78%; and total sales ratio of 30.54% versus 27.80%. Inventory was 57,028 versus 74,539, new listings 18,424 versus 23,289, and sales 17,417 versus 20,725. Median days on market rose from 16 to 22; reported price per square foot was $393 versus $419 and average home size 3,279 versus 3,176 square feet.
The attached-home graphic reports median list price of $1,081,750 versus $949,500; median sale price of $902,475 versus $880,000; median sale-to-list ratio of 99.90% versus 98.89%; and sales ratio of 24.05% versus 19.84%. Inventory was 18,786 versus 25,797, new listings 5,992 versus 7,509, and sales 4,518 versus 5,119. Median days on market rose from 18 to 22; reported price per square foot was $500 versus $484 and average home size 1,905 versus 1,901 square feet.
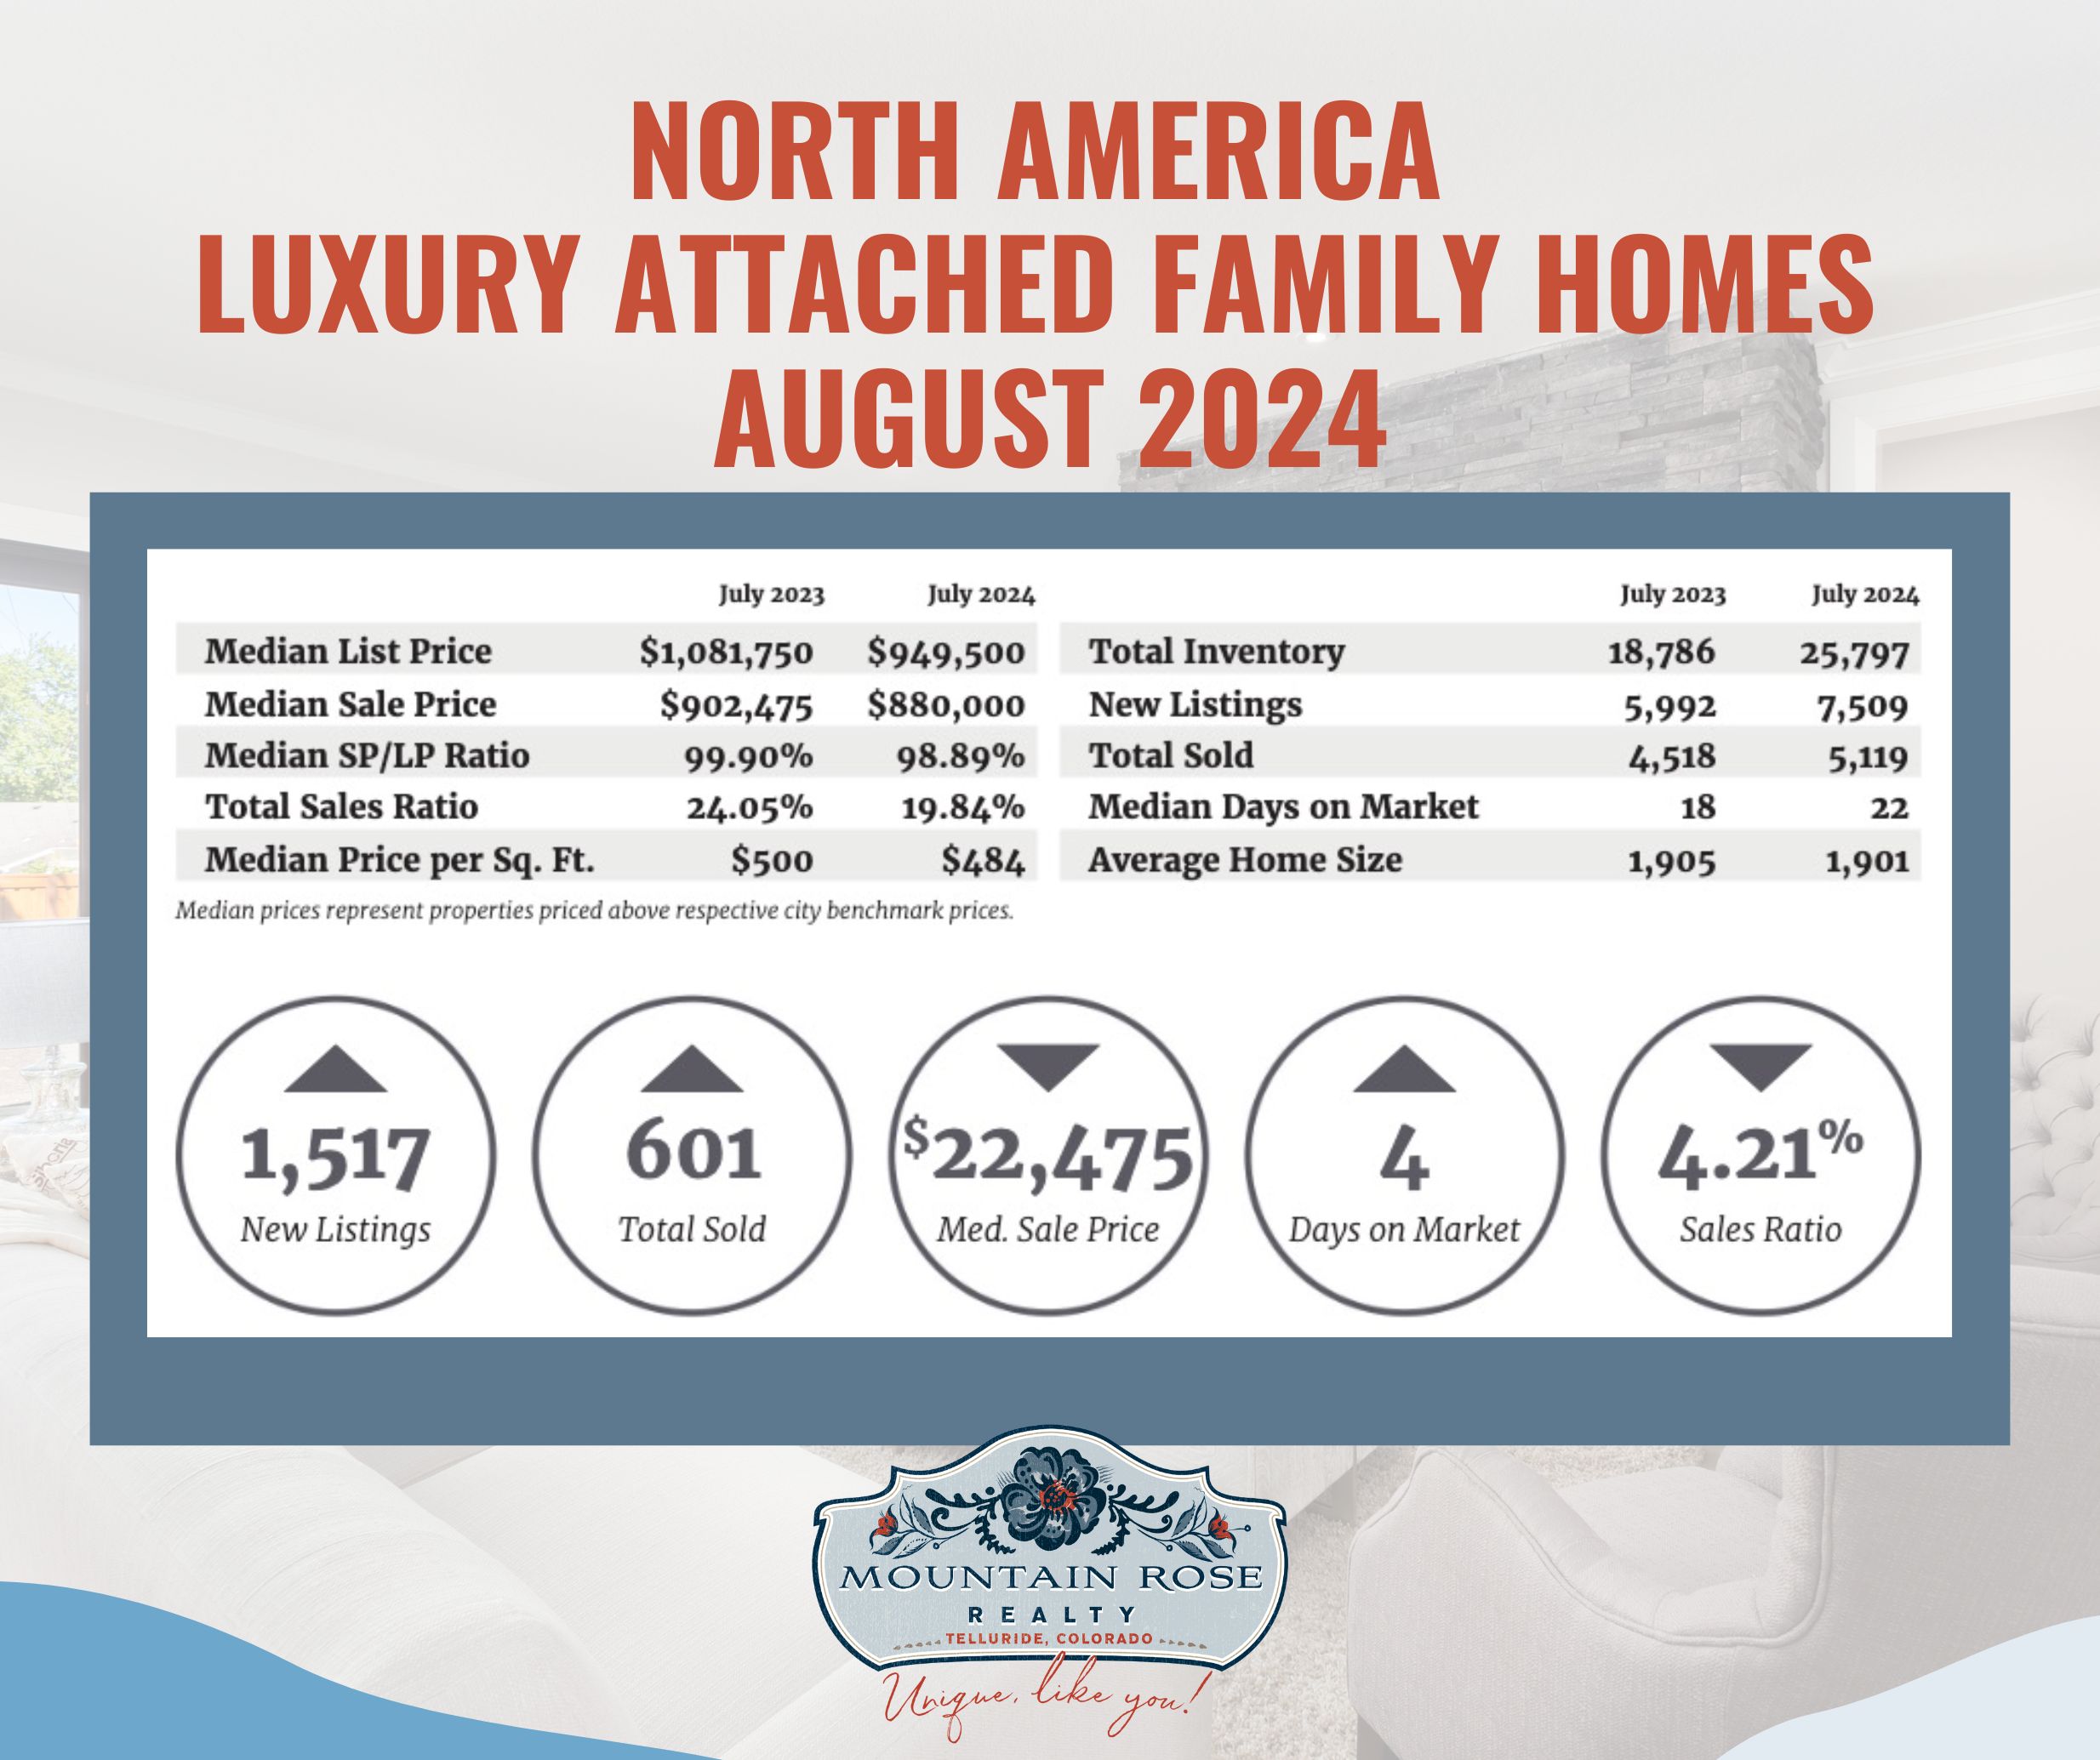
The graphics’ changes in sales ratio, 2.74 and 4.21, are percentage-point differences, not proportional price changes. Their price figures apply to properties above the respective city benchmarks.
The original summary reported January–July sales growth of 14.82% for North American single-family luxury homes and 11.35% for attached homes versus the same 2023 period. It also described a nearly 2% rise in median sold prices for the top 10% of the market since January 2024. Those longer-window statements differ from the graphics’ July-to-July comparison and should not be presented as Telluride growth rates.
The wider discussion considered inventory, interest rates and buyers’ interest in distinctive design, sustainability and exclusivity. These were market themes, not measured causes of the Telluride results or predictions for an individual home.
The report covers properties above its market-specific luxury benchmarks, with active and sold records and no pending properties in the stated data. A sales ratio compares the period’s sales with remaining inventory; it is not the percentage of asking price achieved. Ratios above 100% can occur when sales exceed the inventory remaining at the measurement date, and are not a probability of selling. Small numbers and a changing mix of homes can move medians substantially without measuring the appreciation of the same property.
For a property-specific comparison, contact Anne-Britt Ostlund at Mountain Rose Realty at 970.759.4886 or use our contact page. Compare current local listings and completed sales rather than applying a historical category summary to every home.