

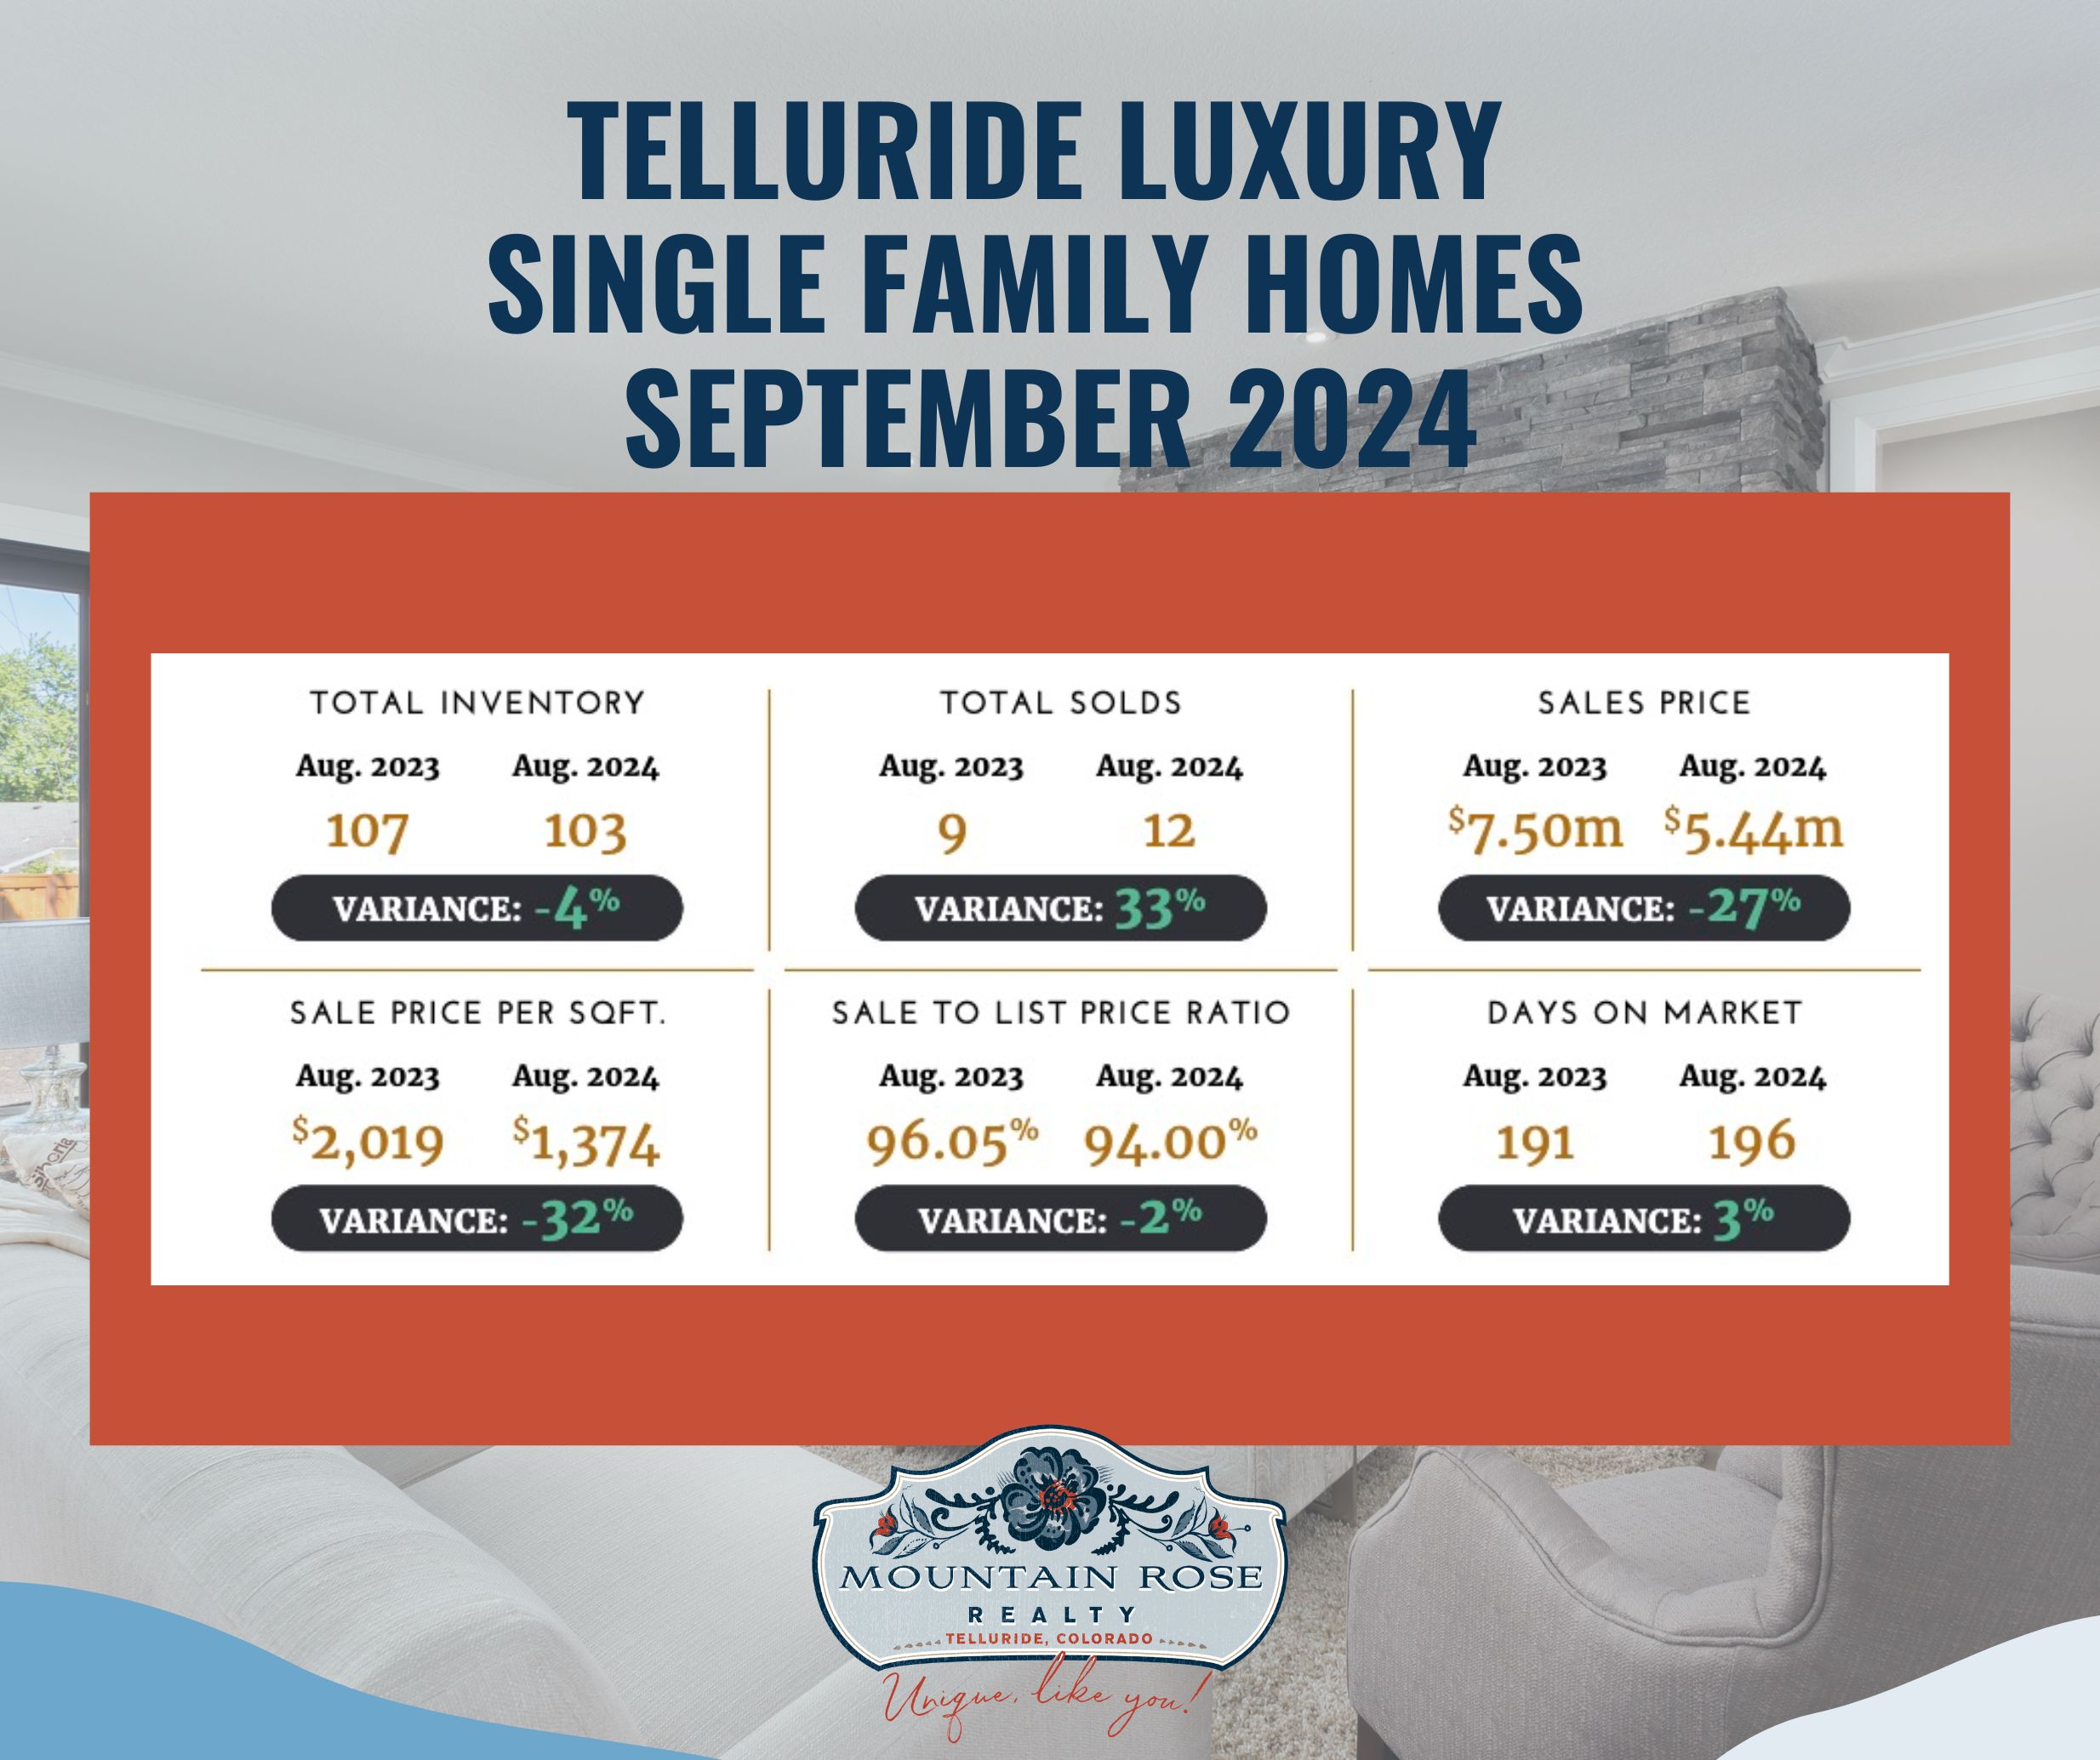
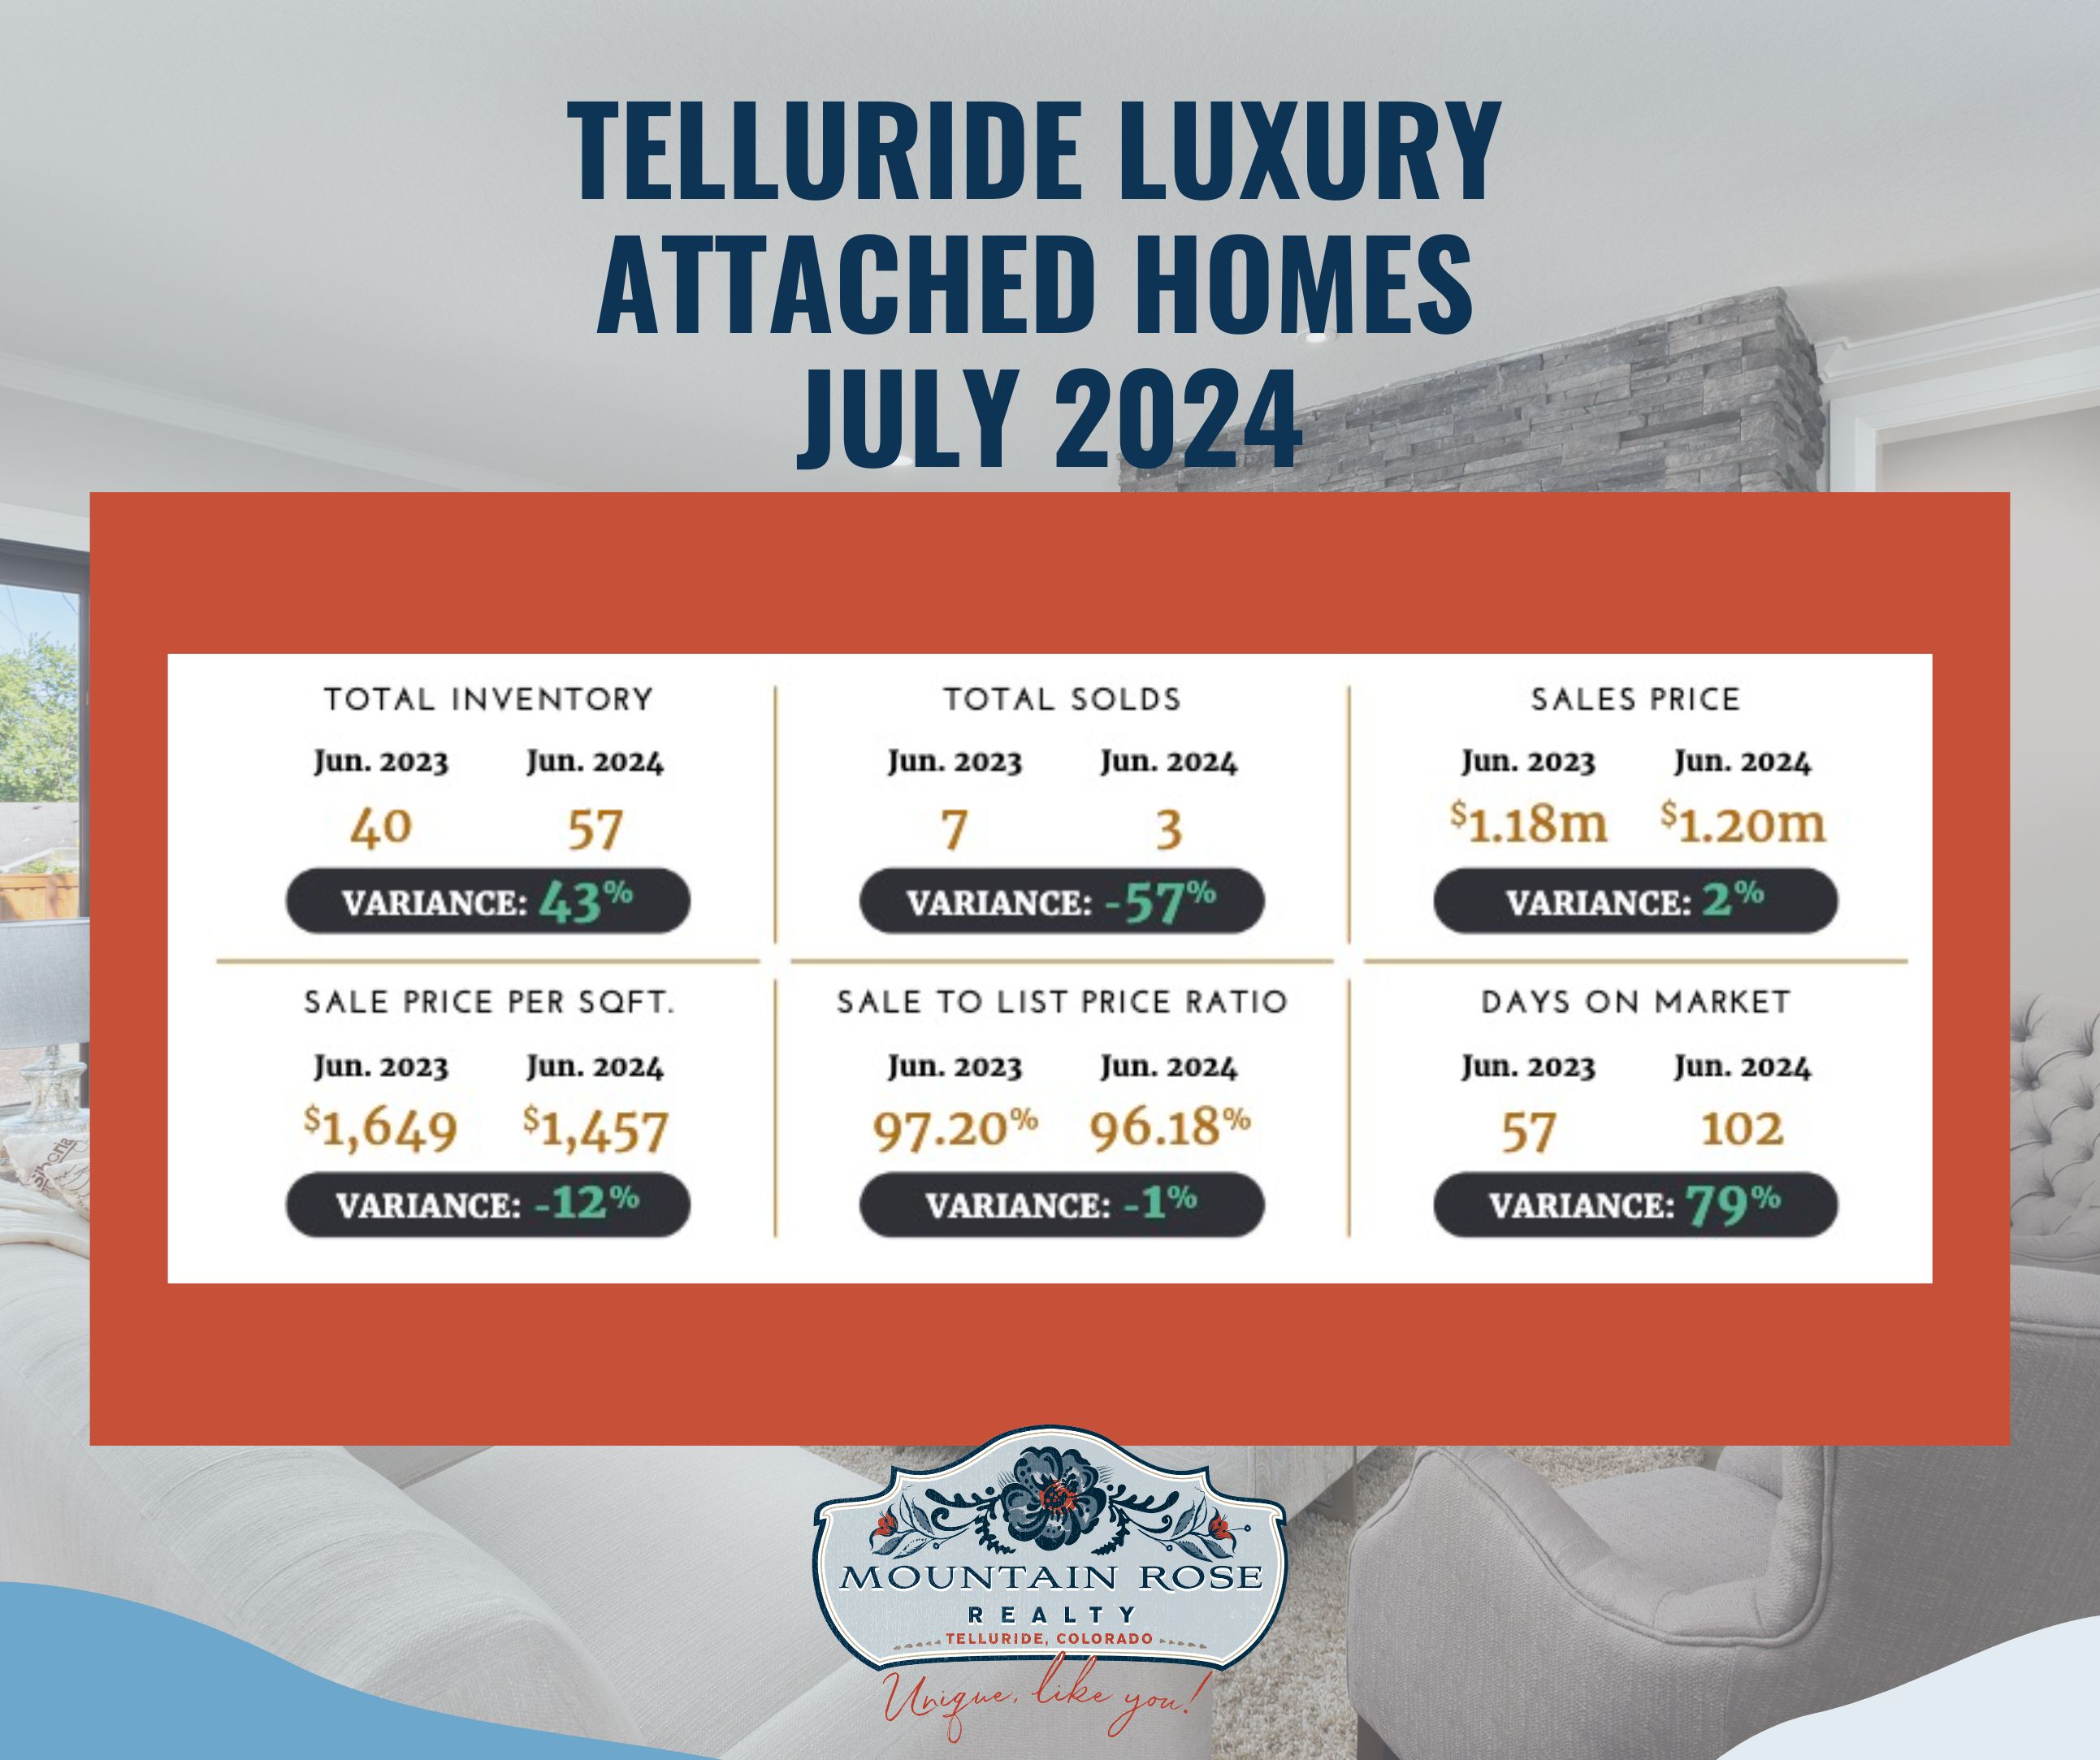
The September 2024 luxury report summarizes August 2024 sales. The single-family graphic below matches that period. The original attached-home graphic is instead labeled July 2024 and compares June 2023 with June 2024; it is retained and identified as an older comparison, not used as evidence for August.
Open the original 22-page luxury report for its category definitions, tables and North American comparisons.
The report classified the single-family segment as balanced, with a 12% sales ratio. It recorded 103 properties in inventory and 12 sales, compared with 107 and nine in August 2023. The median sale price was $5,442,500, shown rounded to $5.44 million in the chart, compared with $7.50 million a year earlier.
The median sale-to-list ratio was 94.00%, not an average, compared with 96.05% in August 2023. Reported sale price per square foot declined from $2,019 to $1,374. Median days on market rose from 191 to 196. The most active band was $4,000,000–$4,749,999, with a 33% sales ratio.
Pages 20–21 of the embedded September report classify attached homes as a buyer’s market with a 10% sales ratio. They record 67 properties in inventory and seven sales, compared with 34 and 14 in August 2023. The median sale price was $2,950,000, compared with $1,416,000 a year earlier.
The median sale-to-list-price ratio was 96.53% versus 97.51%, and reported sale price per square foot was $1,781 versus $1,534. Median days on market rose from 68 to 100. The most active band was $2,500,000–$2,999,999, with a 100% sales ratio. That band had one sale and one remaining listing, illustrating how a small denominator can produce a high ratio.
The original graphic below is an older June comparison from the July edition. It shows inventory of 40/57, sales of seven/three, rounded median prices of $1.18/$1.20 million, sale price per square foot of $1,649/$1,457, sale-to-list ratios of 97.20%/96.18%, and median days of 57/102 for June 2023/June 2024. Those are not August figures.
The broader commentary discussed a slight change in median sale prices over the first eight months of 2024 and the possibility that the mix of lower-priced luxury transactions affected the median. It also discussed inventory, financing conditions, customized homes, design and the experience of living in a property. These themes do not demonstrate growing confidence among Telluride cash buyers or establish the cause of the local figures.
The North American attached-home summary in the September report was balanced at a 19.77% sales ratio. The broad claim that the entire luxury market favored sellers therefore should not be applied uniformly across categories. Local market labels and medians also do not guarantee exposure, transaction security or an investment outcome.
The report covers properties above its market-specific luxury benchmarks, with active and sold records and no pending properties in the stated data. A sales ratio compares the period’s sales with remaining inventory; it is not the percentage of asking price achieved. Ratios above 100% can occur when sales exceed the inventory remaining at the measurement date, and are not a probability of selling. Small numbers and a changing mix of homes can move medians substantially without measuring the appreciation of the same property.
For a property-specific comparison, contact Anne-Britt Ostlund at Mountain Rose Realty at 970.759.4886 or use our contact page. Compare current local listings and completed sales rather than applying a historical category summary to every home.