

February 2025 archive: This report summarizes January 2025 luxury-market data published with the February 2025 report. It is not a current pricing, availability, or negotiation recommendation. The embedded charts use the report’s property categories and source-period definitions.
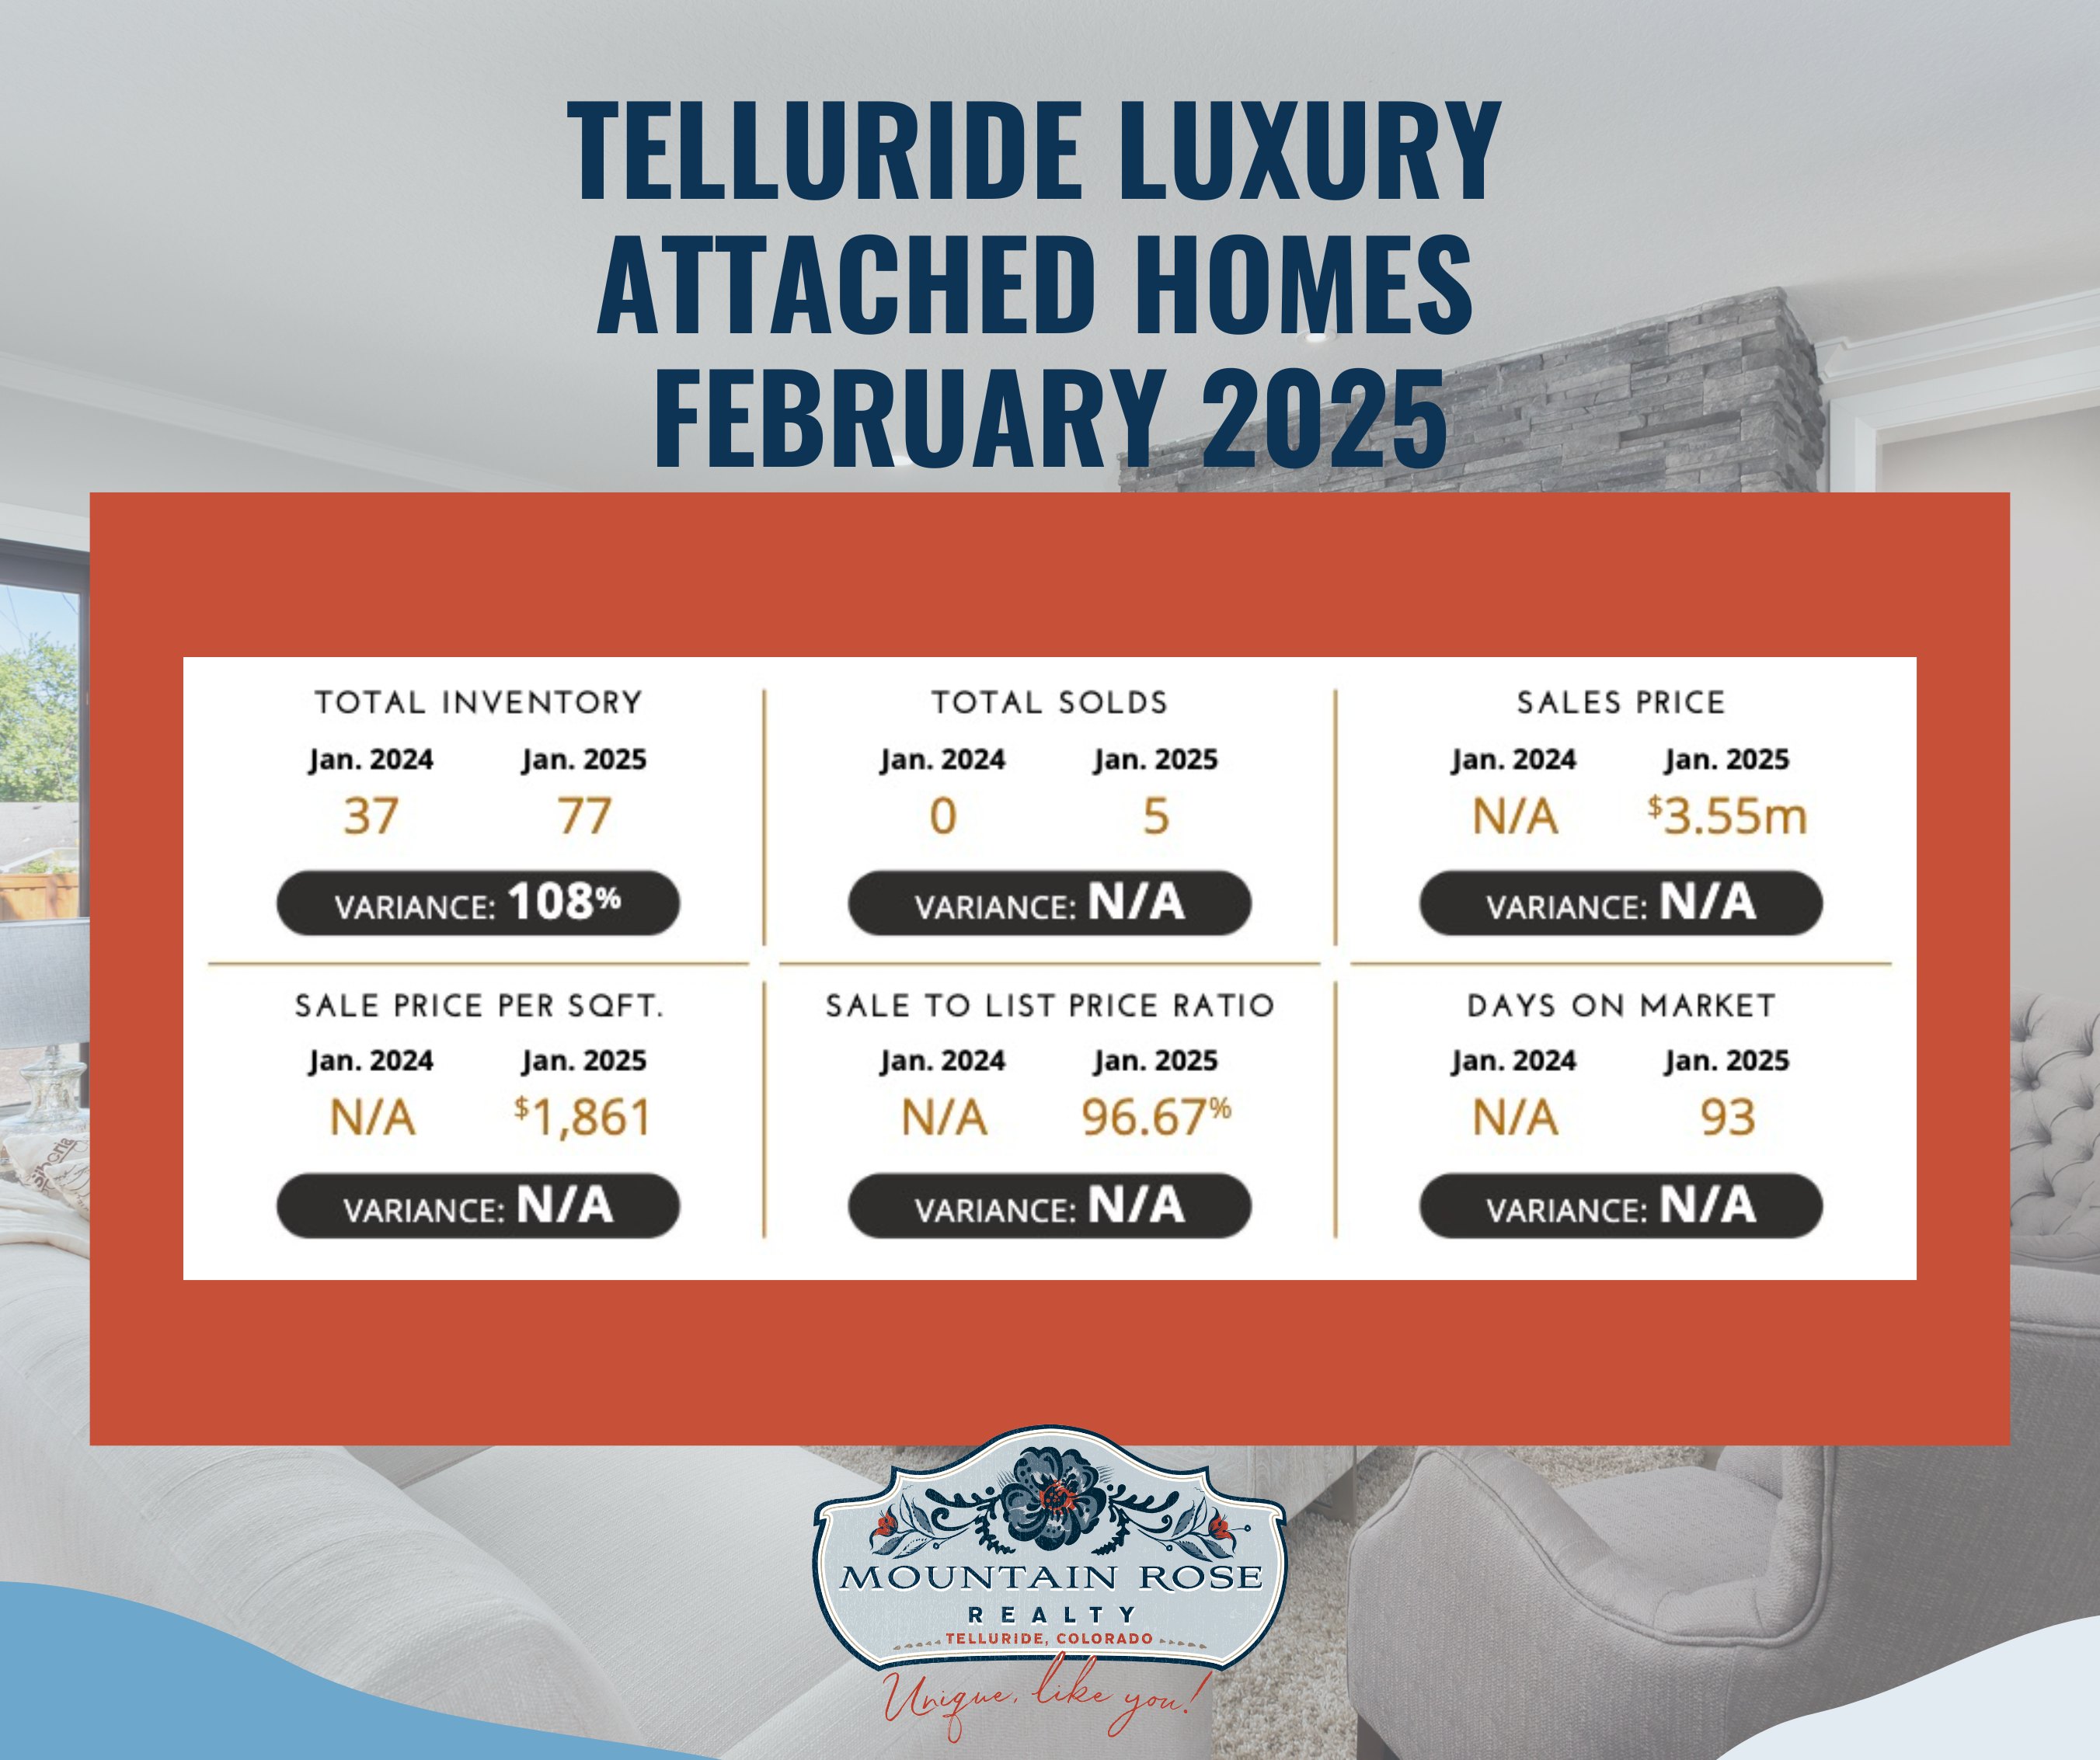
| Measure | January 2024 | January 2025 |
|---|---|---|
| Inventory | 37 | 77 |
| Sales | 0 | 5 |
| Median sale price | N/A | $3.55 million |
| Median price per square foot | N/A | $1,861 |
| Median sale-to-list ratio | N/A | 96.67% |
| Median days on market | N/A | 93 |
The report labels the attached segment a buyer’s market at a 6% sales ratio, with a $3,550,000 median sale price, 93 median days on market, and a 96.67% median sale-to-list ratio. Its most active listed band was $4 million to $4.99 million, with a 29% sales ratio. A sales ratio is the report’s closed-sales-to-inventory measure, not a discount or probability for an individual property.
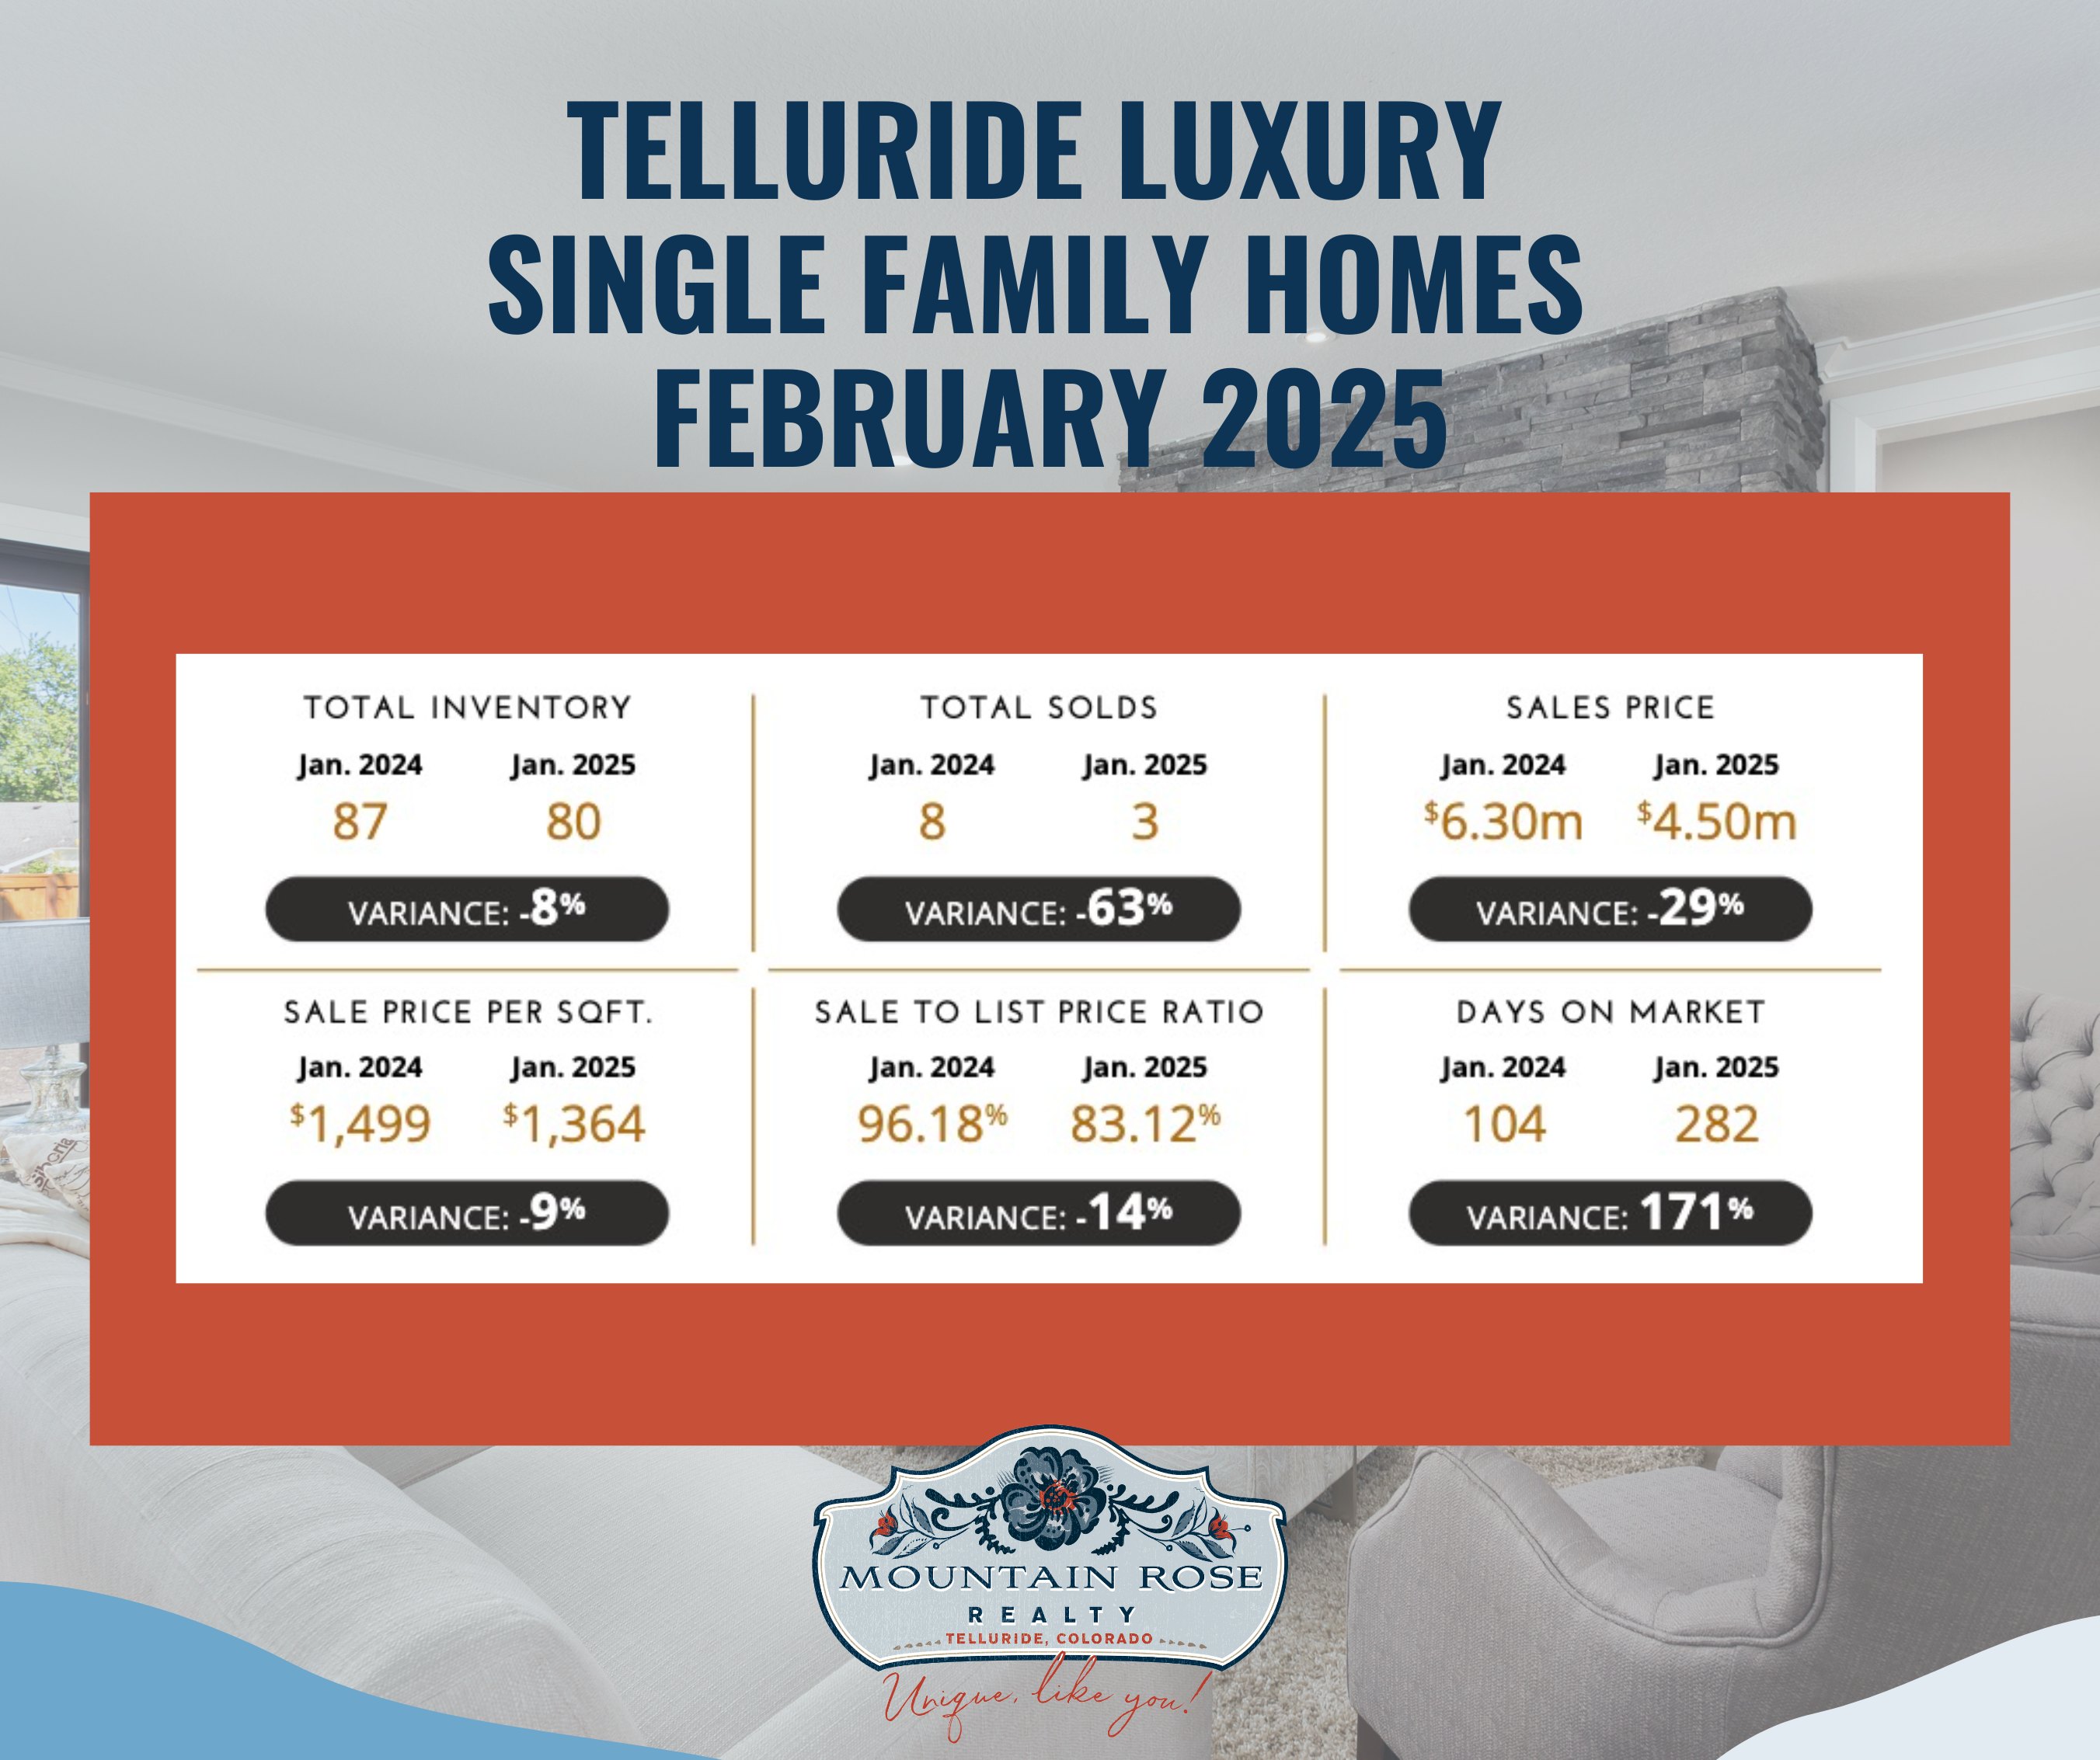
| Measure | January 2024 | January 2025 |
|---|---|---|
| Inventory | 87 | 80 |
| Sales | 8 | 3 |
| Median sale price | $6.30 million | $4.50 million |
| Median price per square foot | $1,499 | $1,364 |
| Median sale-to-list ratio | 96.18% | 83.12% |
| Median days on market | 104 | 282 |
For the report’s single-family luxury segment, the original report summary gives a 4% sales ratio, $4,500,000 median sale price, 282 median days on market versus 104 in January 2024, and an 83.12% median sale-to-list ratio. The report identifies $9 million to $9.99 million as the most active displayed band, at a 33% sales ratio. These are small, category-specific historical observations; a median is not an average and does not establish present value or a forecast.
N/A is retained where the chart shows no January 2024 attached sales; it is not a zero price or a calculable year-over-year price change. Five attached sales and three single-family sales in January 2025 are small samples, and changes in medians can reflect the properties that sold.
Compare a current property with truly similar closed sales, active competition, condition, size, location, HOA and ownership constraints, and the timing of the data. The charts are useful context for the January 2025 period, but they do not determine a current listing price, concession, appraisal, financing result, or rental outcome.
The original report described January 2025 North American single-family sales as up 17.6%, attached sales as up 12.7%, and single-family inventory as up 14.4%. The original article does not identify the comparison periods for these three percentage changes, and the two retained Telluride charts do not establish the North American totals or methodology. They should therefore be read as the publisher’s historical context, not as a Telluride measure or a current market conclusion.
For a current property-specific comparison, contact Mountain Rose Realty or review current listings. Ask for the applicable MLS data and the assumptions used in any comparison.