
This archive compares condo and single-family listings in Telluride, Colorado 81435 for the week of January 30, 2025. The original Mountain Rose Realty update and graphics report asking-price and inventory measures. They do not describe current availability or the prices of completed sales.
| Measure | Reported value |
|---|---|
| Median list price | $3,195,000 |
| Median price of new listings | $1,956,500 |
| Price per square foot | $2,031 in the original prose; $2,032 in the graphic |
| Average days on market | 156 |
| Median days on market | 133 |
| Listings with price decreases | 8% |
| Listings with price increases | 0% |
| Relisted | 12% |
| Inventory | 49 |
| Median rent | $6,500; rental period not stated |
| Market Action Index | 28, compared with 23 in the prior-month narrative |
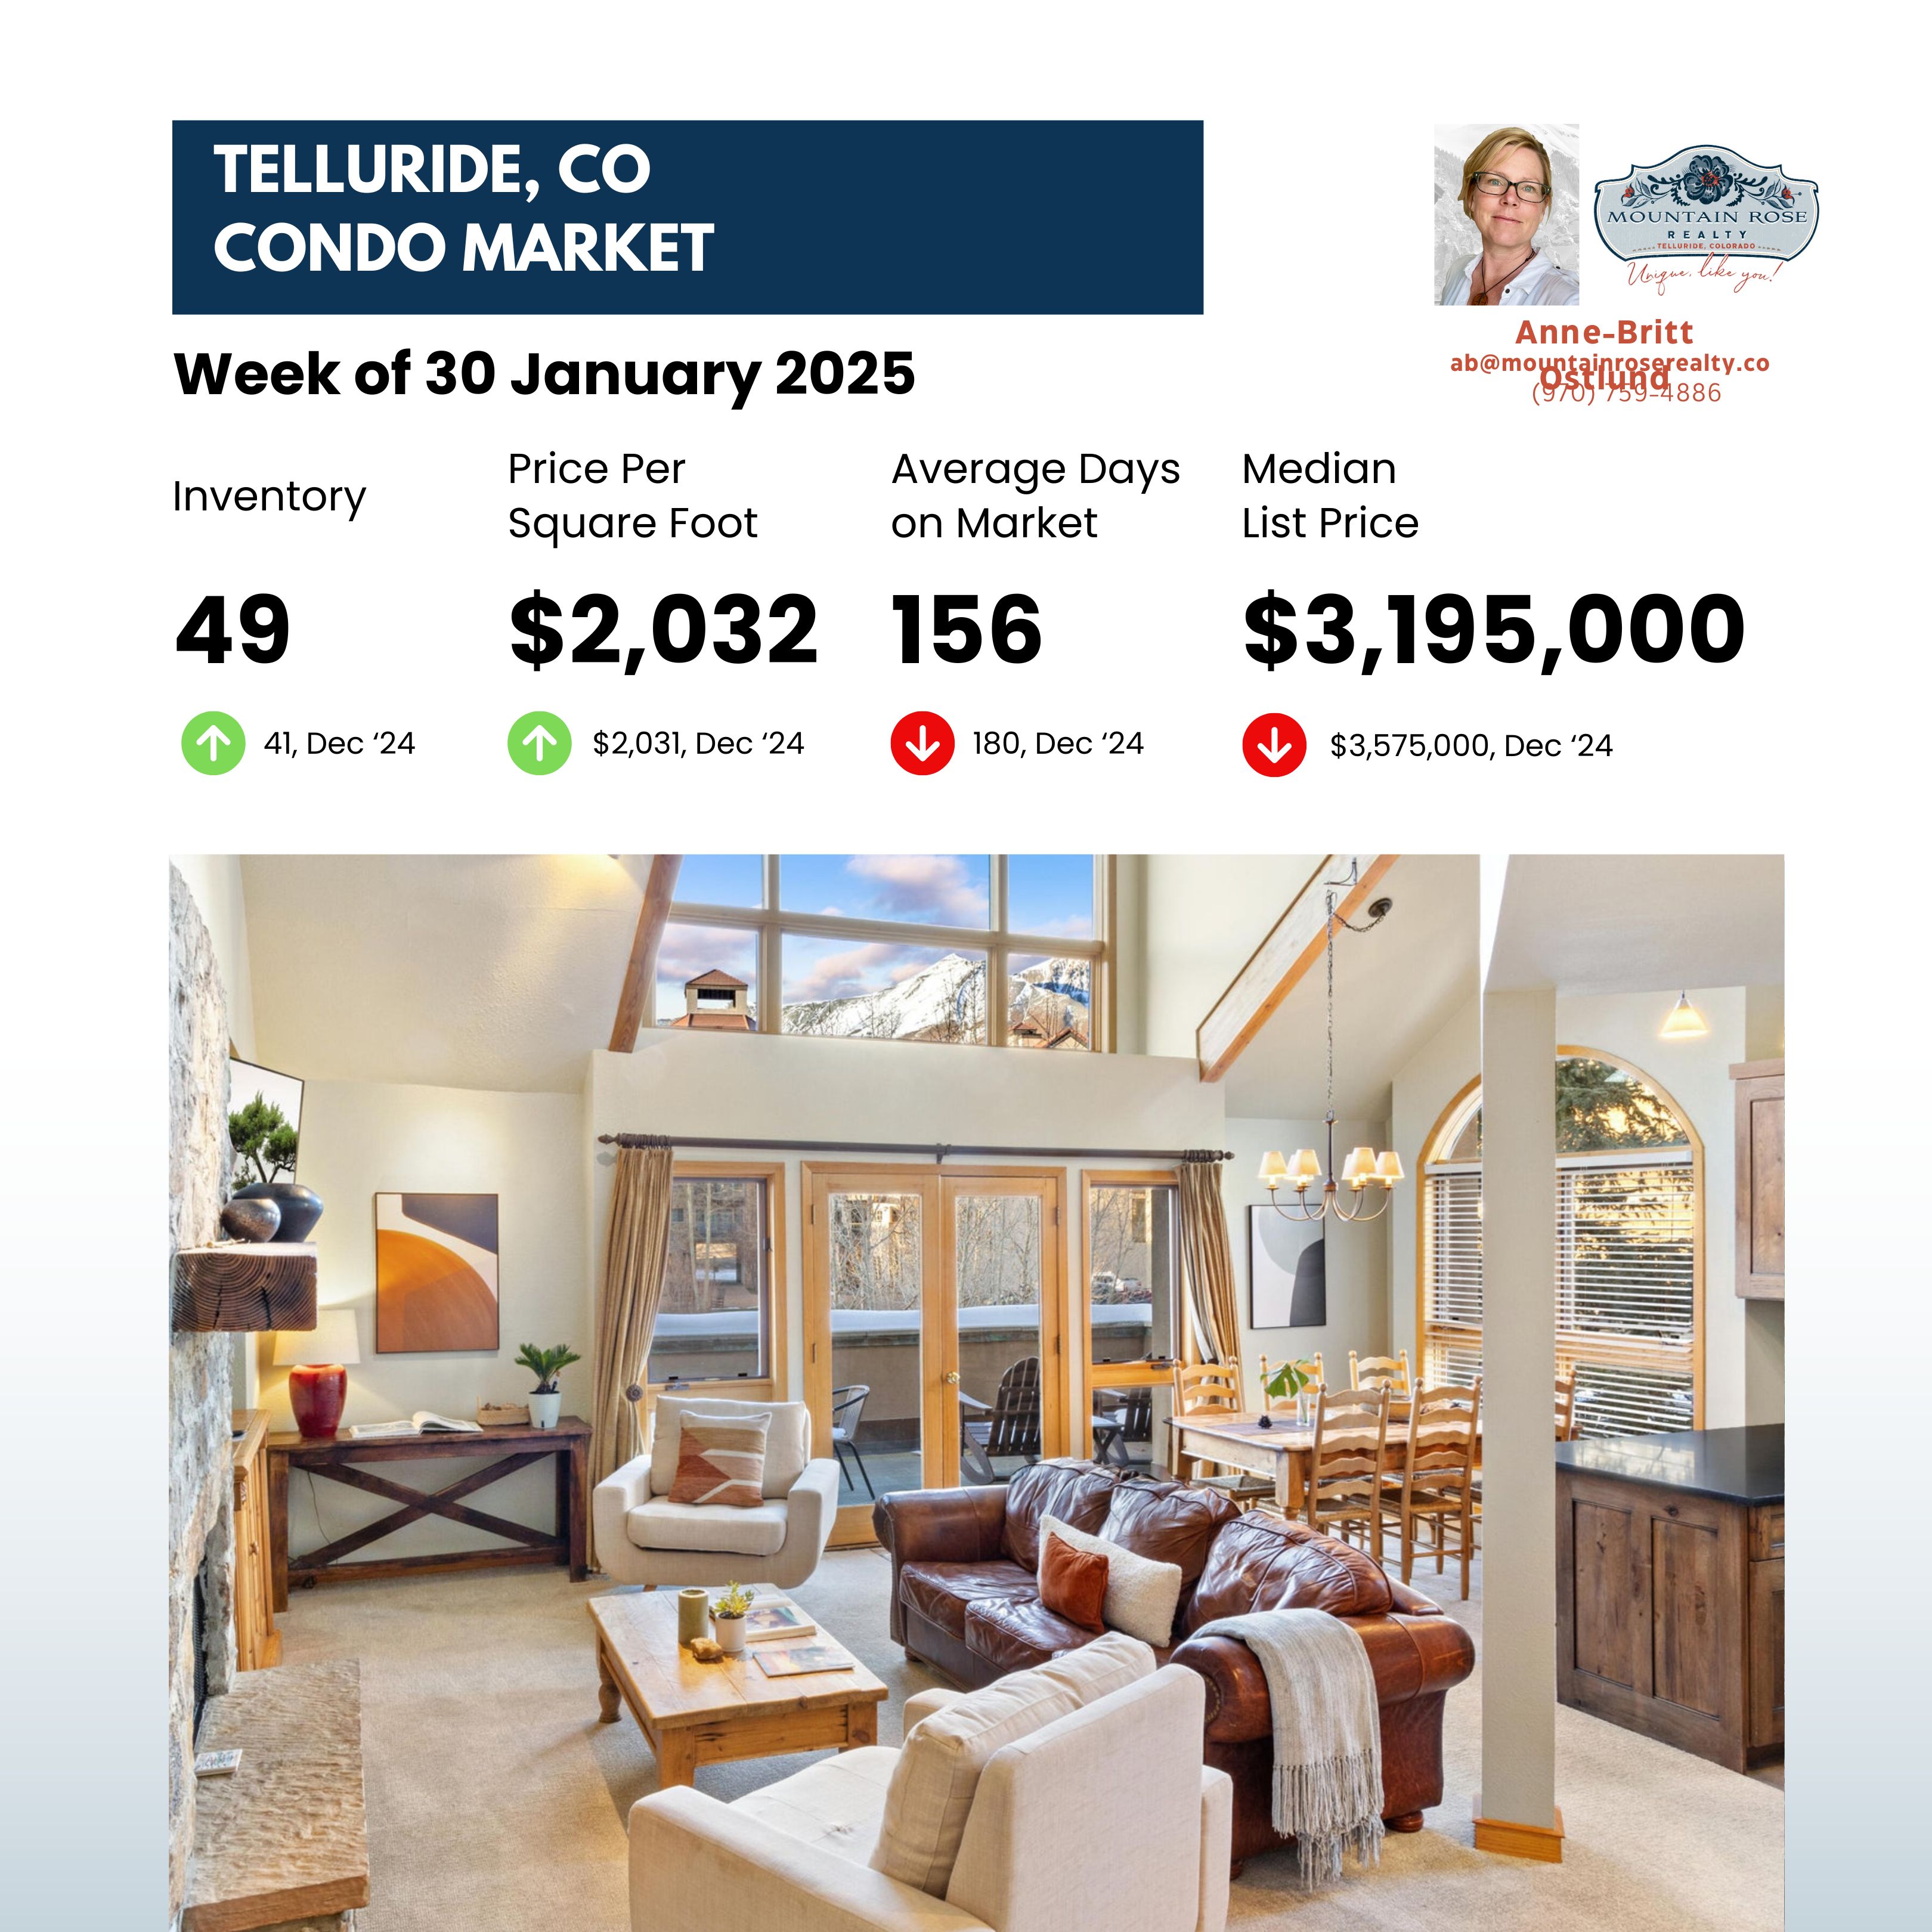
The graphic compares the January snapshot with December 2024: inventory rose from 41 to 49, average days on market fell from 180 to 156, and median list price fell from $3,575,000 to $3,195,000. It shows price per square foot rising from $2,031 to $2,032. The original prose instead gives $2,031 for January. Both source values remain identified here because the underlying listing export is not available to resolve that one-dollar discrepancy.
| Measure | Reported value |
|---|---|
| Median list price | $7,900,000 |
| Median price of new listings | $7,700,000 |
| Price per square foot | $1,751 |
| Average days on market | 350 |
| Median days on market | 224 |
| Listings with price decreases | 11% |
| Listings with price increases | 2% |
| Relisted | 7% |
| Inventory | 45 |
| Median rent | $8,100; rental period not stated |
| Market Action Index | 24, unchanged from the prior-month narrative |
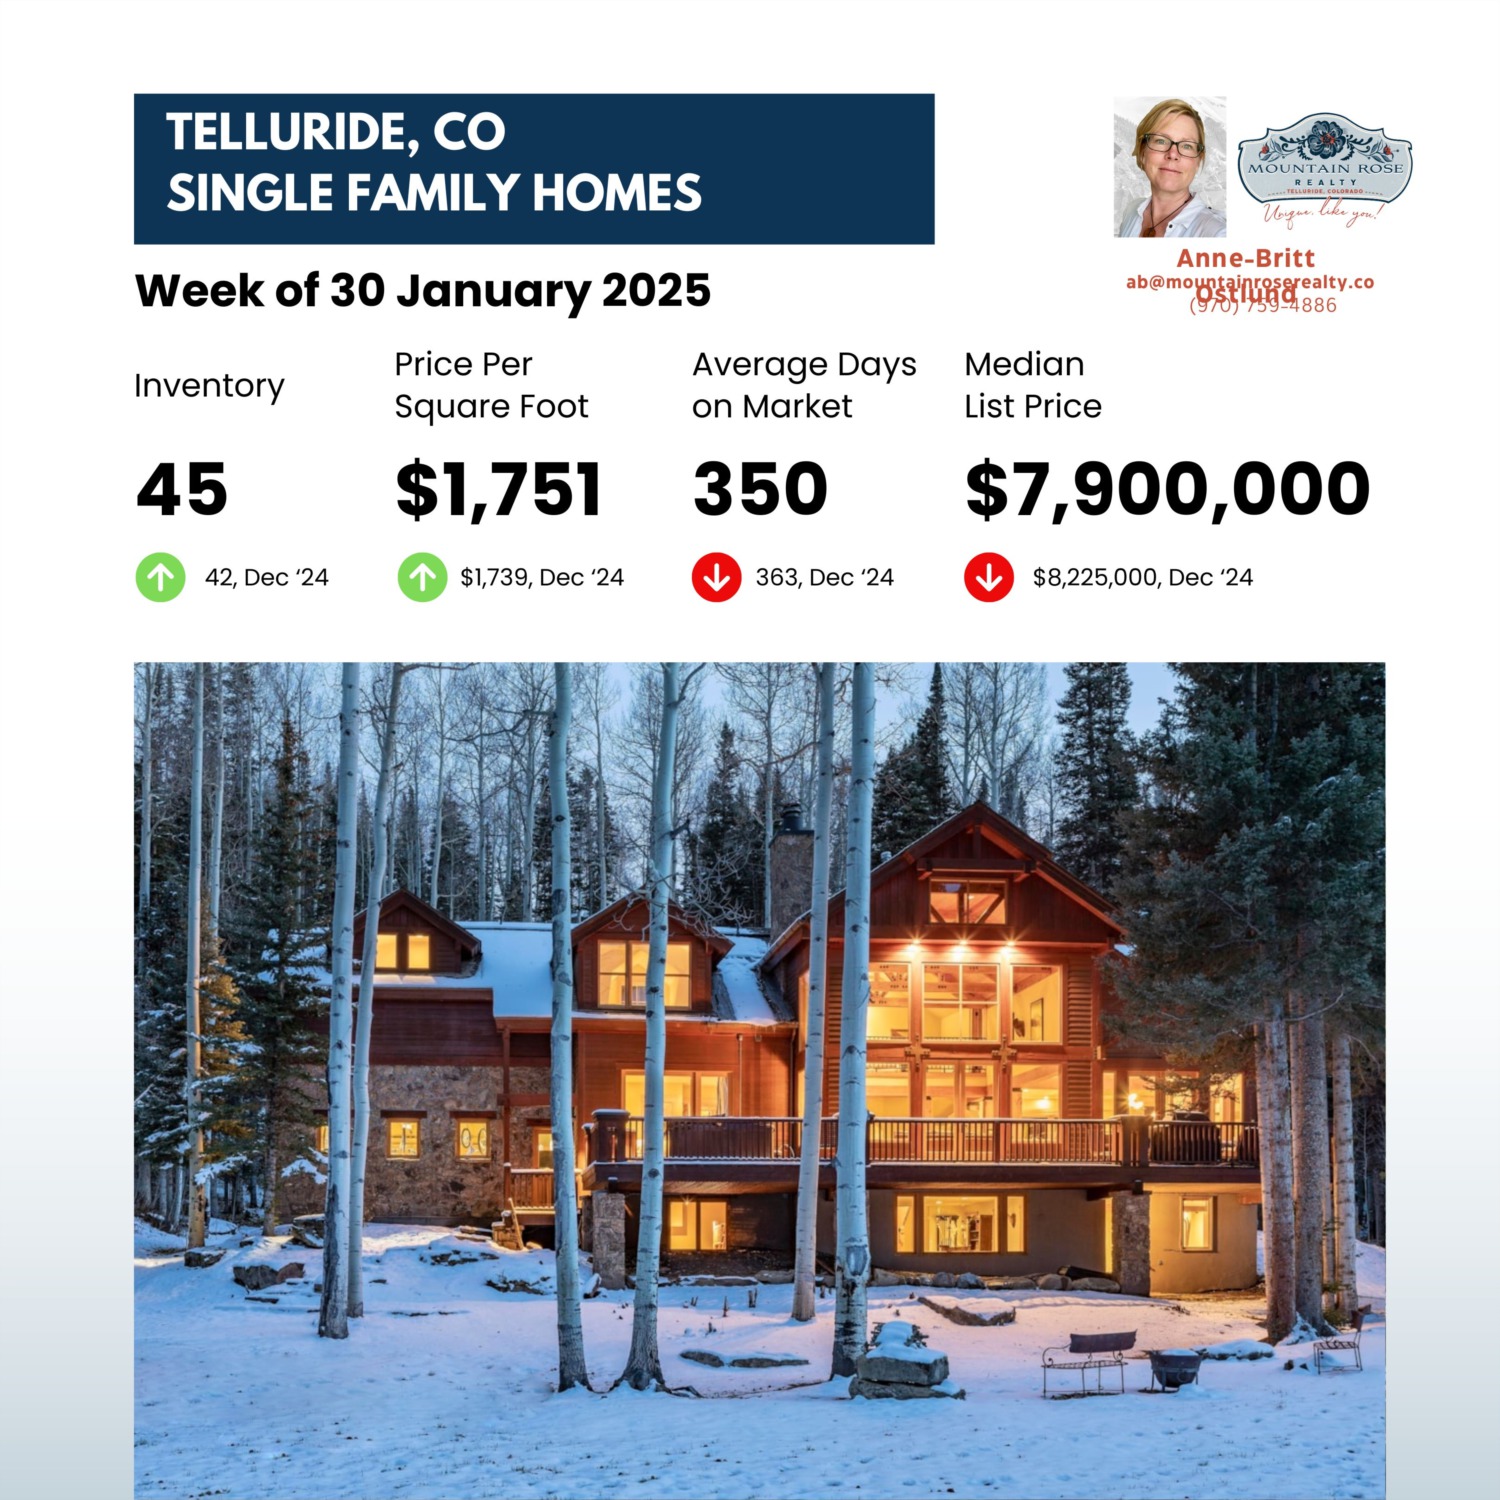
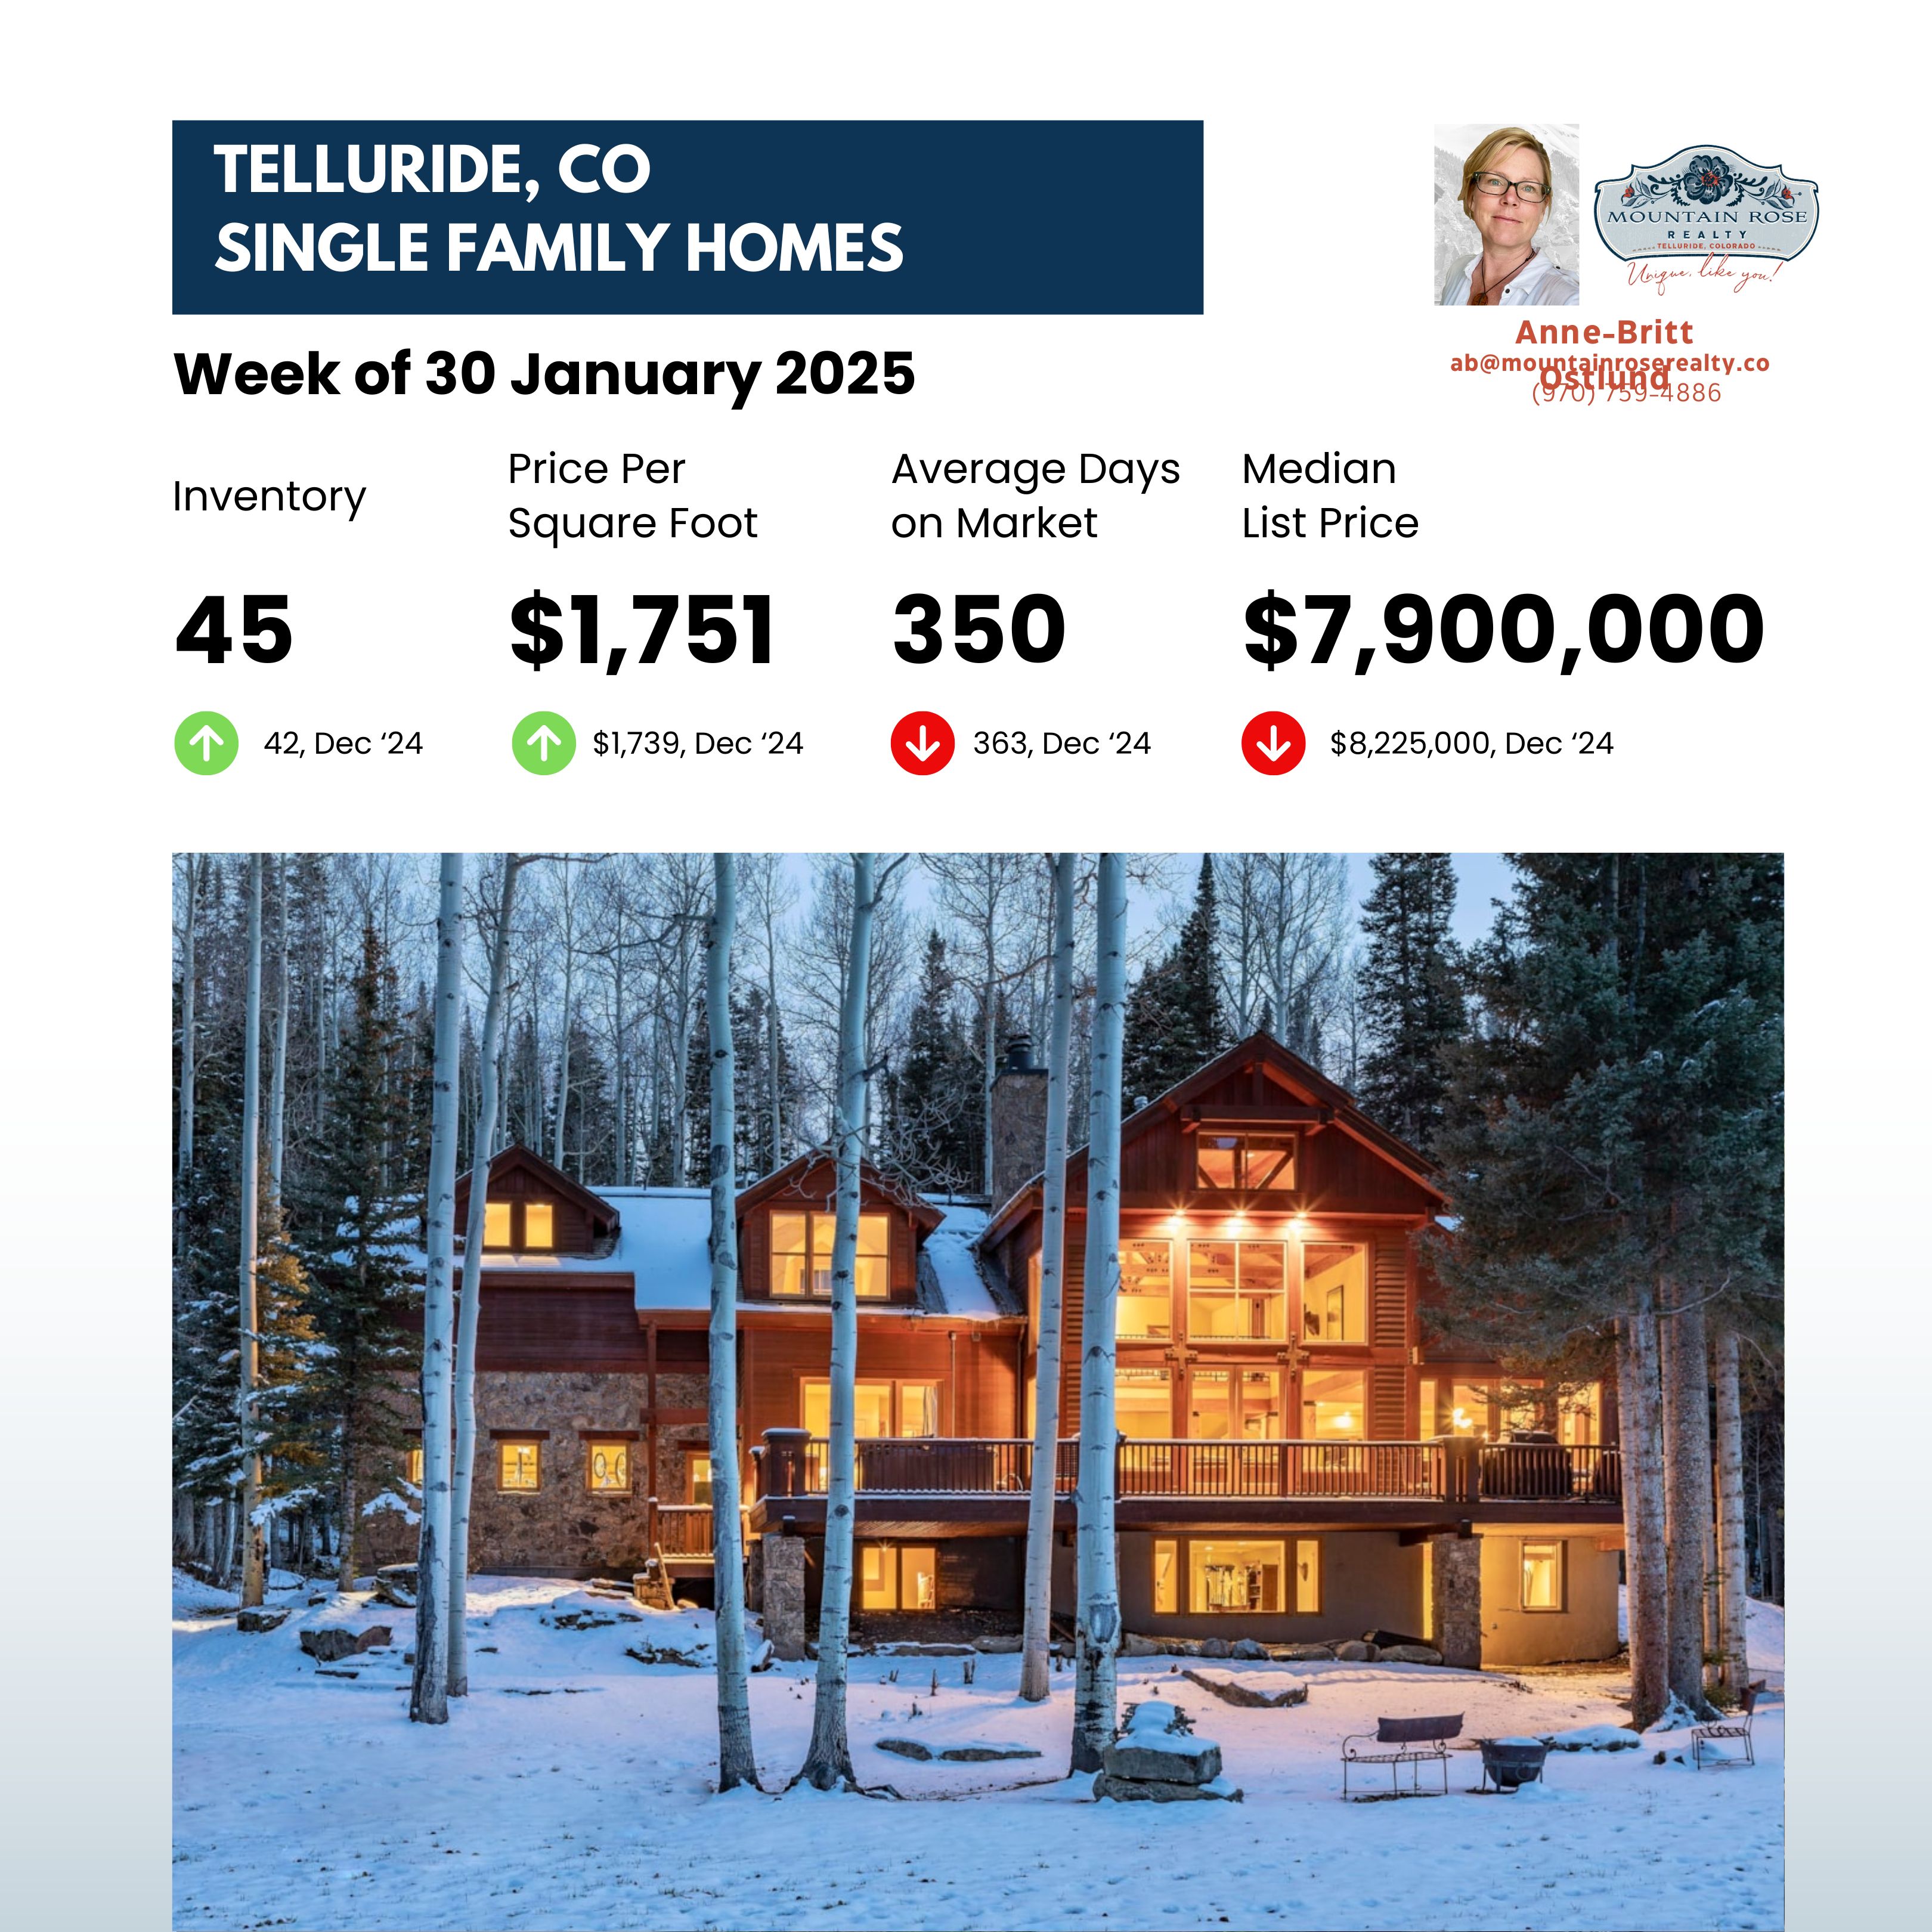
The single-family graphic compares December 2024 inventory of 42 with 45 in January, price per square foot of $1,739 with $1,751, average days on market of 363 with 350, and median list price of $8,225,000 with $7,900,000. These are changes in the listed sample, not a measurement of appreciation or depreciation for the same home.
The Altos explanation of the Market Action Index uses approximately 30 as the balance point between supply and demand. The archived readings of 28 for condos and 24 for single-family homes were below that point. A higher index than the preceding month can describe a change in activity without proving that prices will rise next.
Average and median listing ages are different. The 350-day single-family average and 224-day median should not be interchanged, and neither predicts how long a new listing will take to close. Price-decrease shares describe the proportion of listings marked down, not the size of a discount. Relisted shares are not completed sales.
The rent values are preserved as labeled in the original source, which does not specify a rental period, sample size or short-term rental basis. They cannot support an annual rental-income calculation. The ZIP-code sample should also not be treated as a separate measurement of Telluride town, Mountain Village or every nearby neighborhood.
The condo and single-family samples have different asking prices, inventory and listing ages. Compare a property with similar listings and recent closed sales in its own location, type and price range before using these figures in an offer or listing plan. For a current property-specific discussion, contact Anne-Britt Ostlund at Mountain Rose Realty.