

June 2025 archive: This report summarizes May 2025 luxury-market data. Its charts are retained as dated source material. They do not show today’s inventory, value, buyer behavior, or a guaranteed sale outcome.
The original 22-page report is retained for its source context.
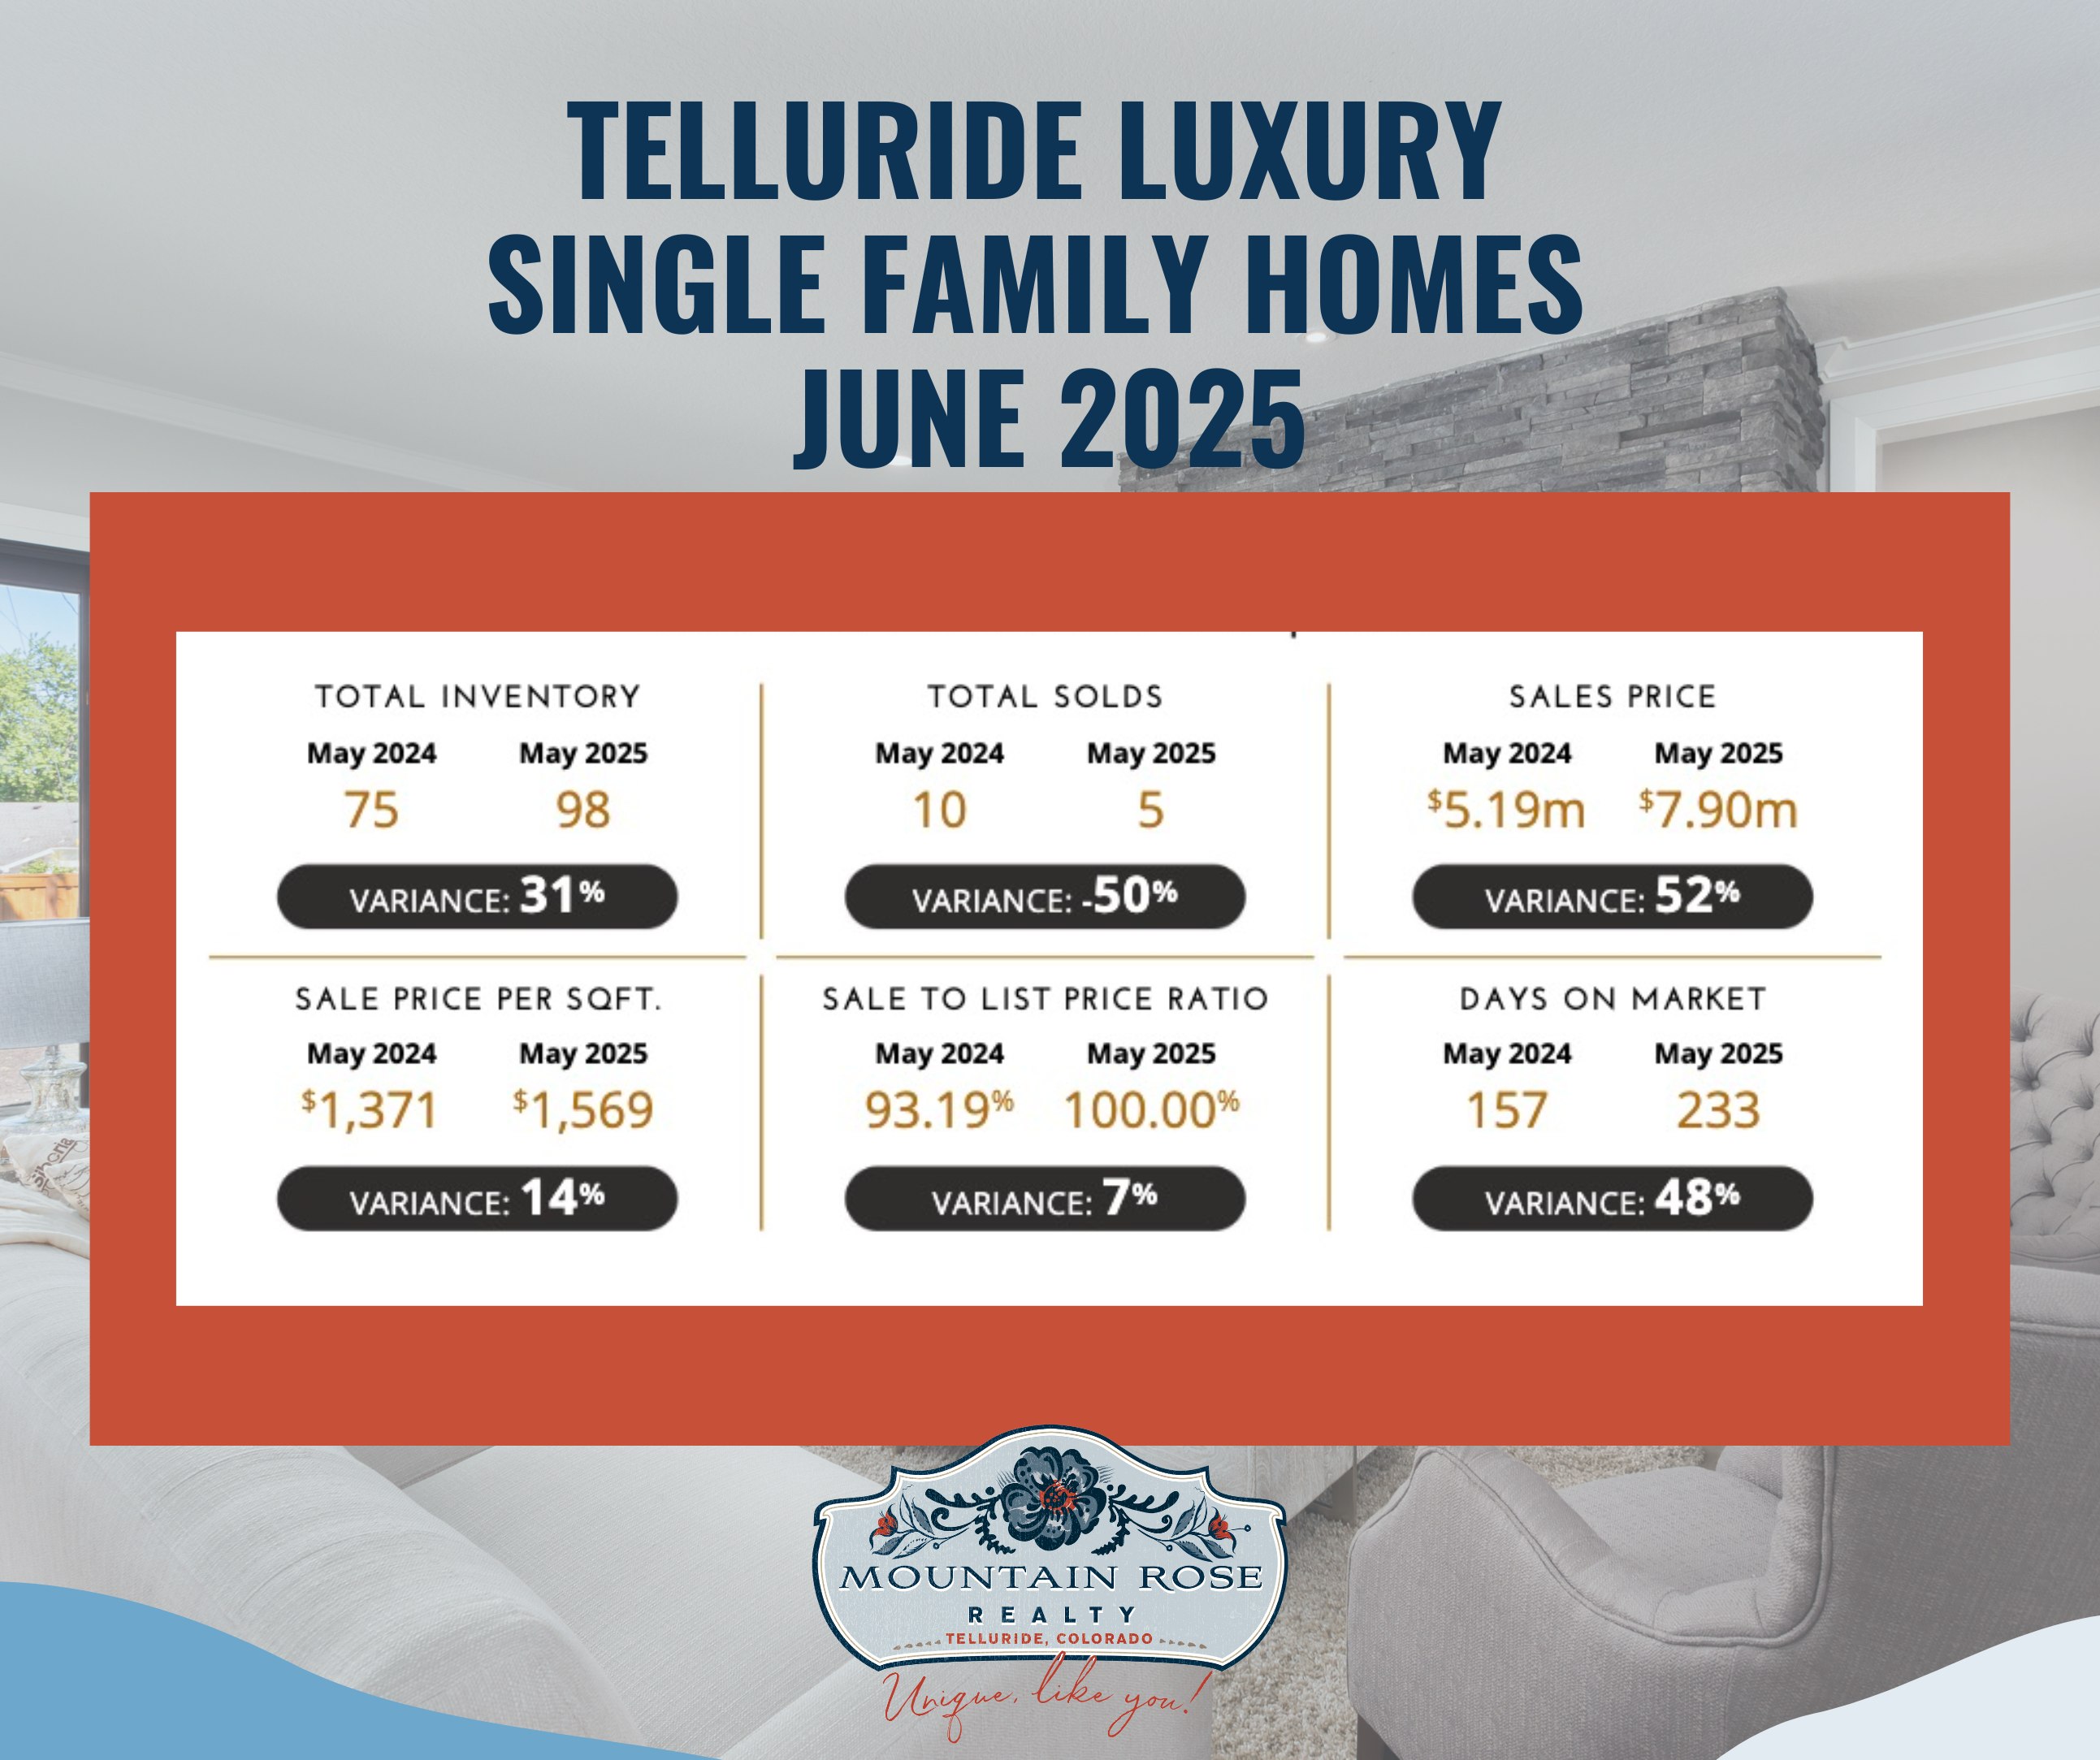
| Measure | May 2024 | May 2025 |
|---|---|---|
| Inventory | 75 | 98 |
| Sales | 10 | 5 |
| Median sale price | $5.19 million | $7.90 million |
| Median price per square foot | $1,371 | $1,569 |
| Median sale-to-list ratio | 93.19% | 100.00% |
| Median days on market | 157 | 233 |
The May chart reports 98 inventory listings and 5 sales, a 5% sales ratio, a $7,900,000 median sale price, 233 median days on market versus 157 in May 2024, and a 100.00% median sale-to-list ratio. It identifies the $4,000,000 to $4,749,999 band as most active at a 33% sales ratio. The displayed 100.00% is the period median sale-to-list ratio, not evidence that every home sold at asking price.
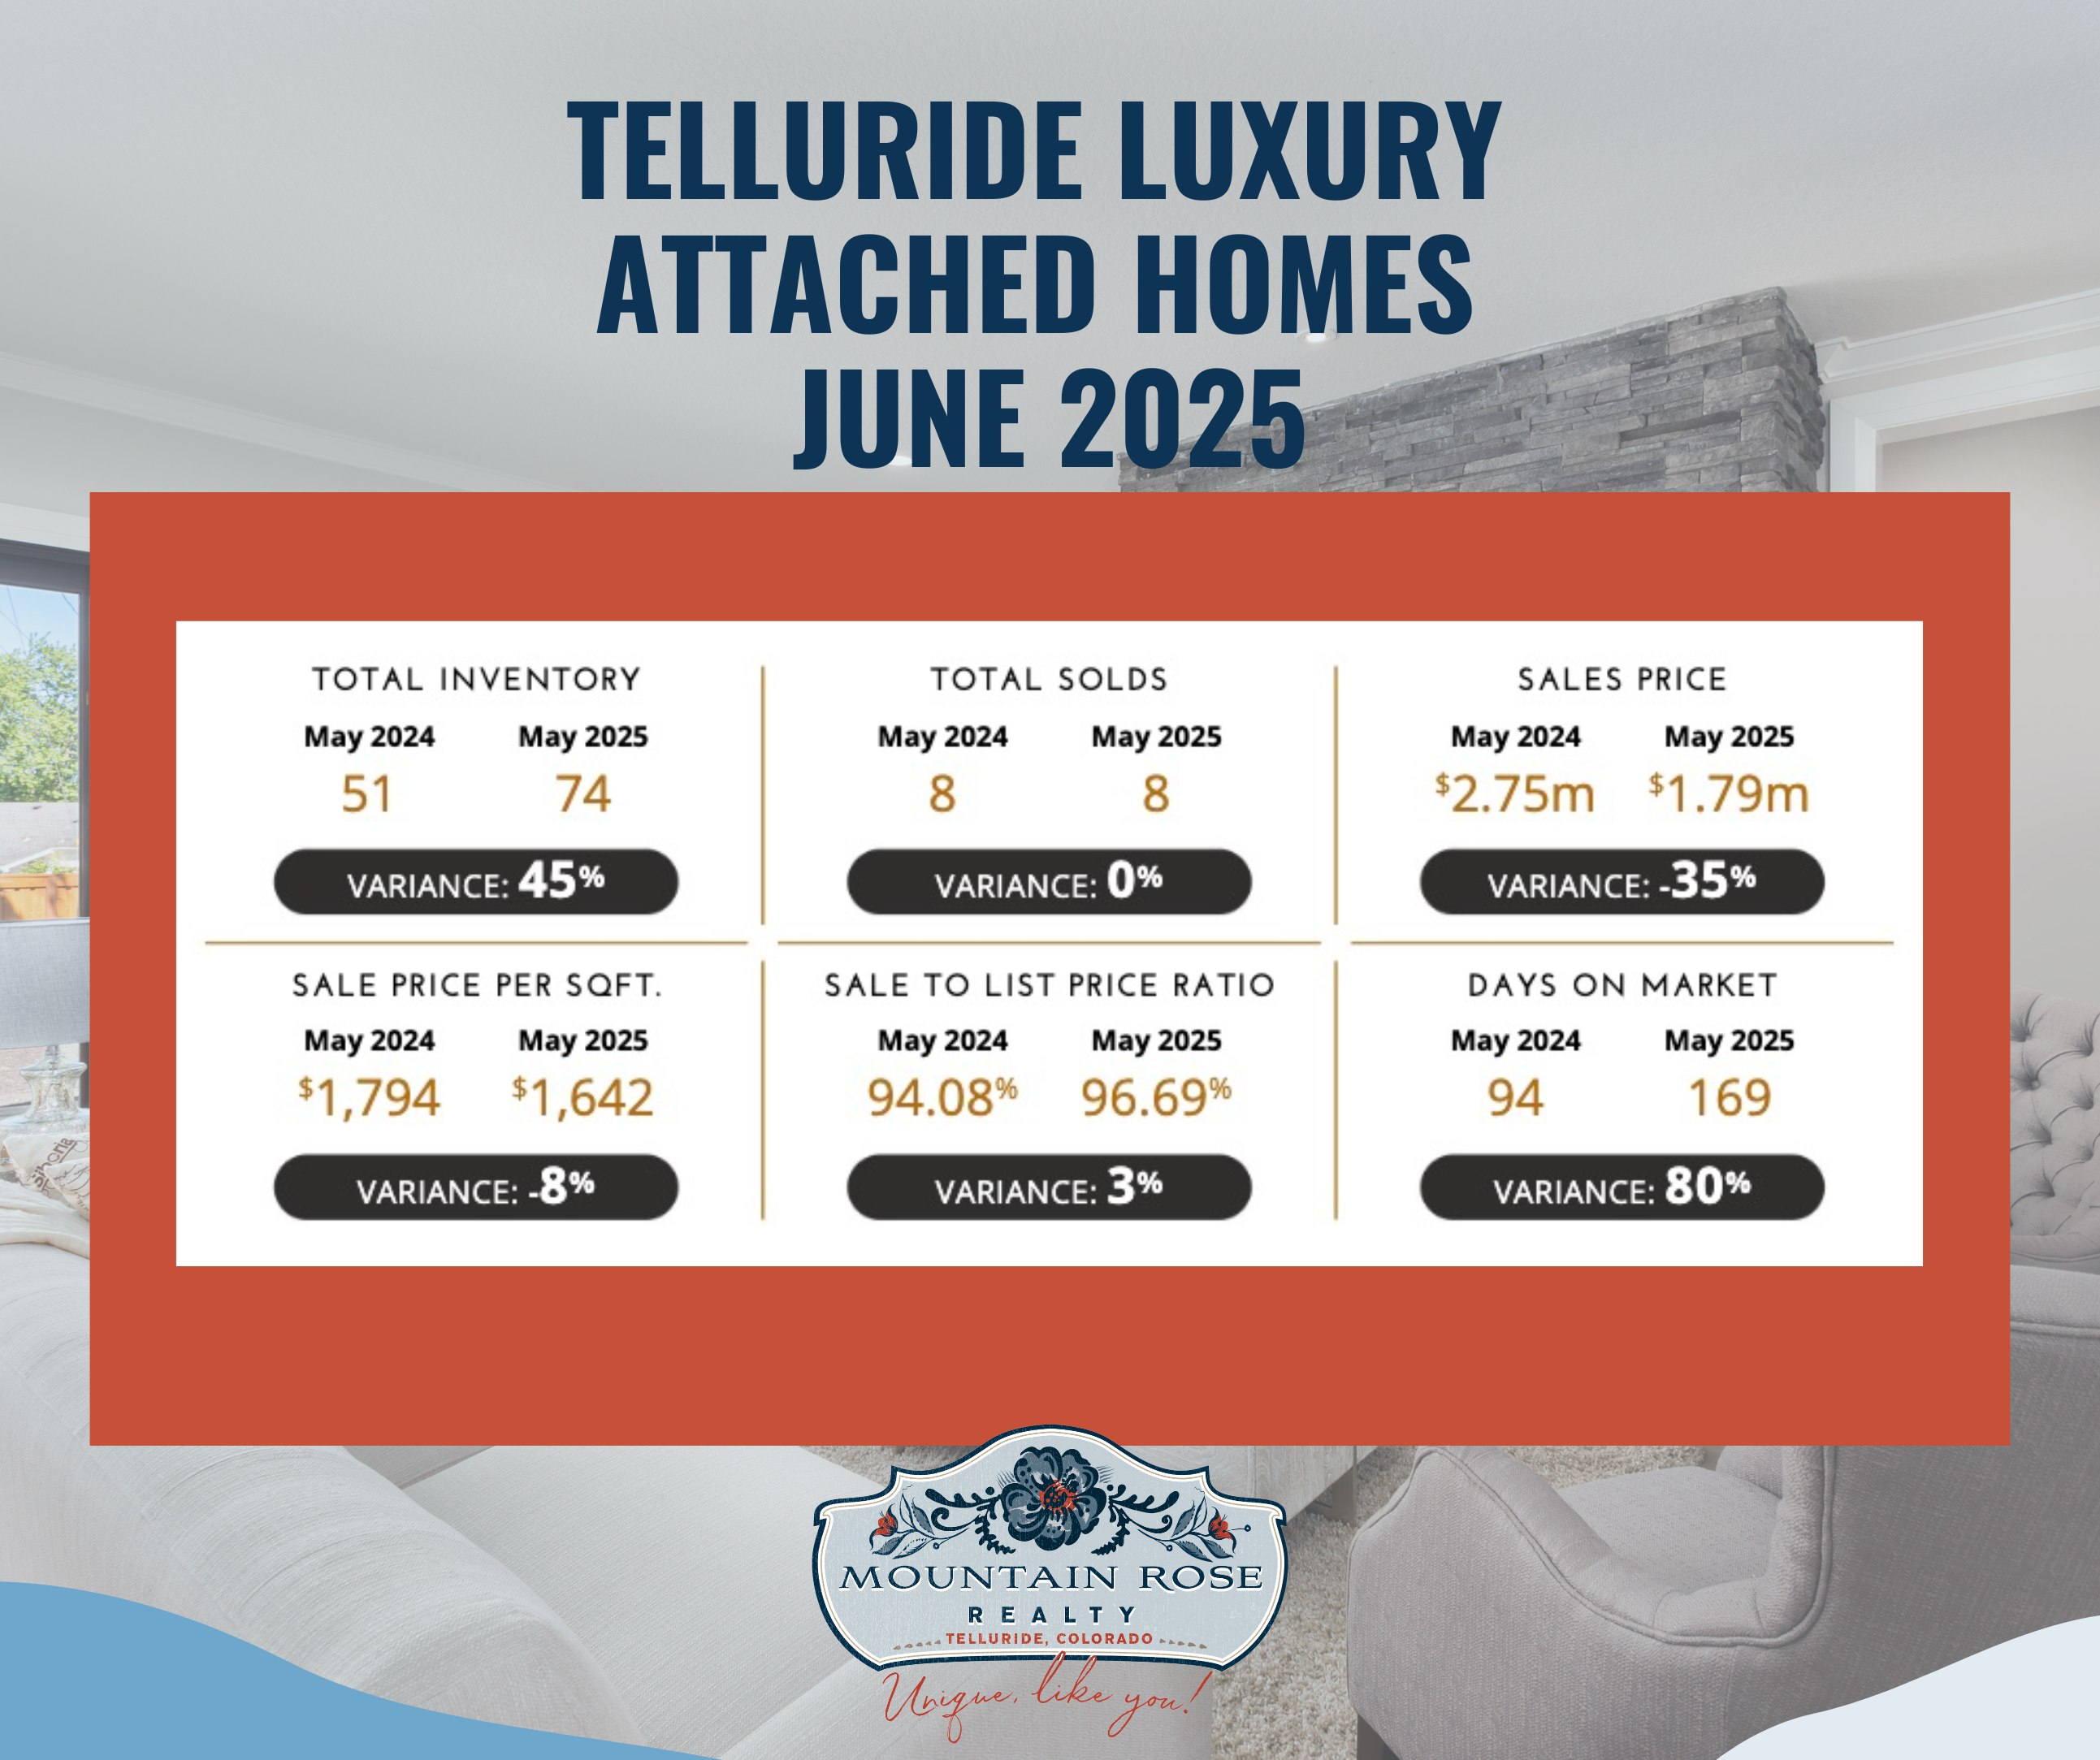
| Measure | May 2024 | May 2025 |
|---|---|---|
| Inventory | 51 | 74 |
| Sales | 8 | 8 |
| Median sale price | $2.75 million | $1.79 million |
| Median price per square foot | $1,794 | $1,642 |
| Median sale-to-list ratio | 94.08% | 96.69% |
| Median days on market | 94 | 169 |
The attached chart reports 74 inventory listings and 8 sales, an 11% sales ratio, a $1,787,500 median sale price, 169 median days on market versus 94 in May 2024, and a 96.69% median sale-to-list ratio. Its $500,000 to $599,999 band shows one sale and two inventory listings, a 50% sales ratio. The figures describe the report’s displayed categories and period, not a current negotiation rule or rental opportunity.
The report defines the sales ratio as sold properties divided by inventory and uses median values. It states that the data includes active and sold properties, excluding pending properties. A median is not an average, and changes in a small set of sales can reflect the mix of properties transacting. Any current price, concession, financing, ownership, or timing decision needs comparable recent sales and property-specific due diligence.
The text tables preserve all six comparison measures from each chart. The chart rounds the May 2025 attached median to $1.79 million; the report gives it more precisely as $1,787,500. Attached median days on market rose from 94 to 169, about 80%, while single-family median days rose from 157 to 233. This does not show that every home took longer or that the same homes appreciated. Five single-family sales and eight attached sales in May 2025 make the property mix particularly important.
For a current property-specific market comparison, contact Mountain Rose Realty, follow Facebook, or review Instagram.