

August 2023 national price-data archive. This infographic compares month-to-month home-value changes in six national provider series. It preserves the data available for this article's 2023 publication; the headline is not a statement about today's market.
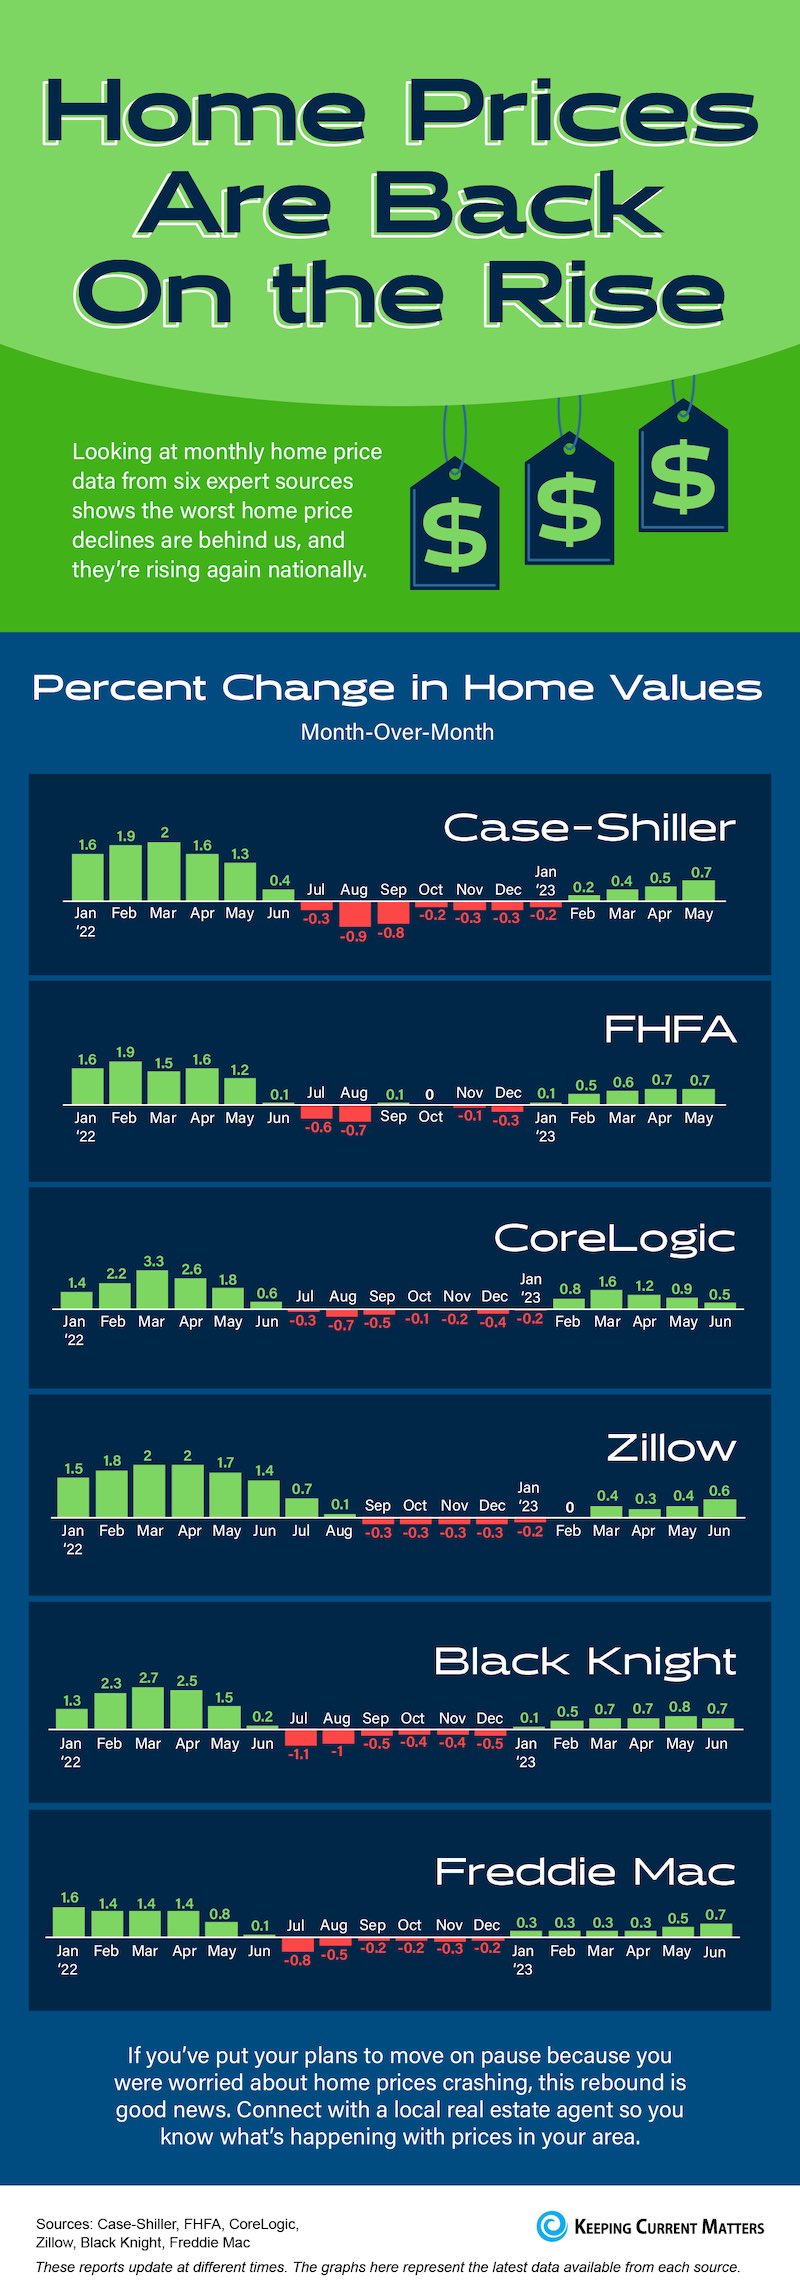
The graphic names Case-Shiller, FHFA, CoreLogic, Zillow, Black Knight and Freddie Mac. Each panel starts in January 2022. Case-Shiller and FHFA extend through May 2023; the other four extend through June 2023. The footer notes that provider revisions and reporting dates can differ.
The panels show negative monthly readings during parts of the second half of 2022 and positive readings later in early-to-mid 2023. That is a description of these historical series, not proof that price declines could never resume. Month-over-month and year-over-year comparisons answer different questions; neither should be substituted for the other.
These national series do not establish a Telluride rebound or a timetable to buy. Local results can differ by property type, price band, condition and supply. Compare recent local closed sales and active alternatives alongside financing, inspection findings, insurance, HOA obligations and carrying costs before choosing a strategy.