

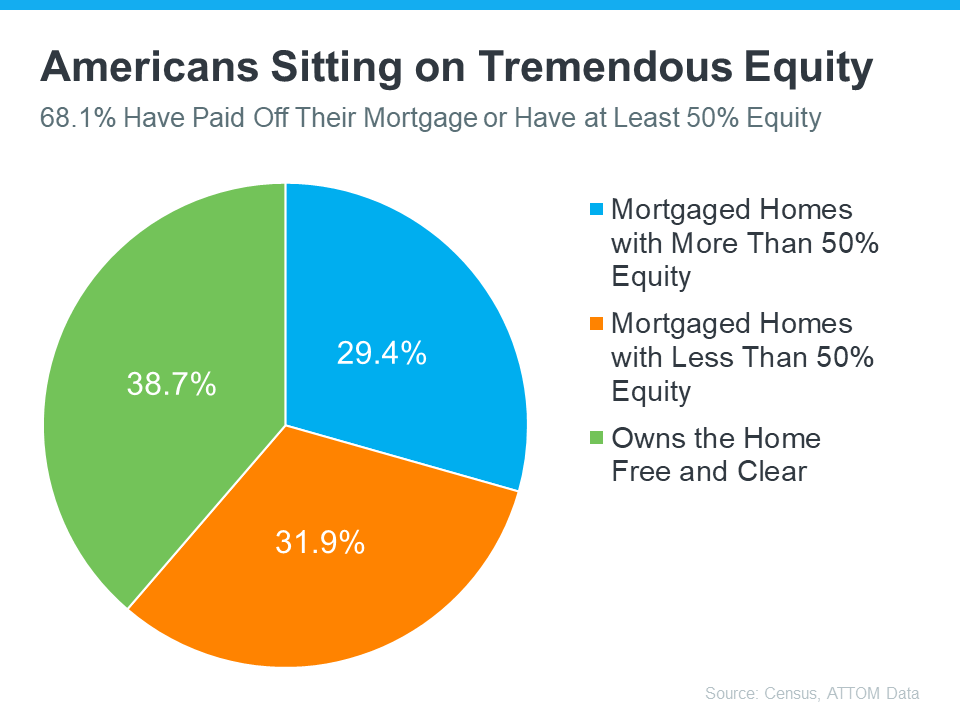
This March 2023 article discussed home equity using a national graphic credited to Census and ATTOM Data. The graphic is historical context, not a current estimate for a Telluride homeowner.
The chart divides homes into three groups: 38.7% owned free and clear, 29.4% mortgaged homes with more than 50% equity, and 31.9% mortgaged homes with less than 50% equity. The first two groups sum to 68.1%. This describes homes grouped by mortgage and equity status, not 68.1% of all Americans. The graphic does not print the underlying observation date or method for combining its two cited sources, so it should not be used as a newly verified population estimate.
Equity is an estimate of property value less the debt secured by it. It can change with both market value and principal repayments; it does not necessarily rise every year. Paying interest does not reduce the loan principal. An estimate for a specific home needs a defensible current value range and current loan balances.
A seller’s available proceeds also depend on the agreed sale price, payoff amounts, transaction expenses, negotiated credits and any applicable taxes or other obligations. A national equity graphic cannot tell a household how much cash it will receive at closing. Ask for a property-specific net sheet and discuss tax questions with a qualified tax professional.
If sale proceeds would fund a down payment, compare the timing of both transactions and the complete cost of the replacement home. Include closing costs, financing, taxes, insurance, maintenance and any HOA obligations. Borrowing against equity introduces another debt and repayment obligation; it does not turn equity into free cash.
Mountain Rose Realty can help compare recent local sales and discuss a selling plan. A lender can assess financing options and a closing professional can explain estimated payoffs and settlement expenses. None of these estimates guarantees a price, closing date or future appreciation.