
March 2025 report archive, covering February 2025. The original North America luxury report was presented by Mountain Rose Realty and Anne-Britt Ostlund. Its two retained graphics compare February 2024 and February 2025. The category summaries and named local comparisons below are historical.
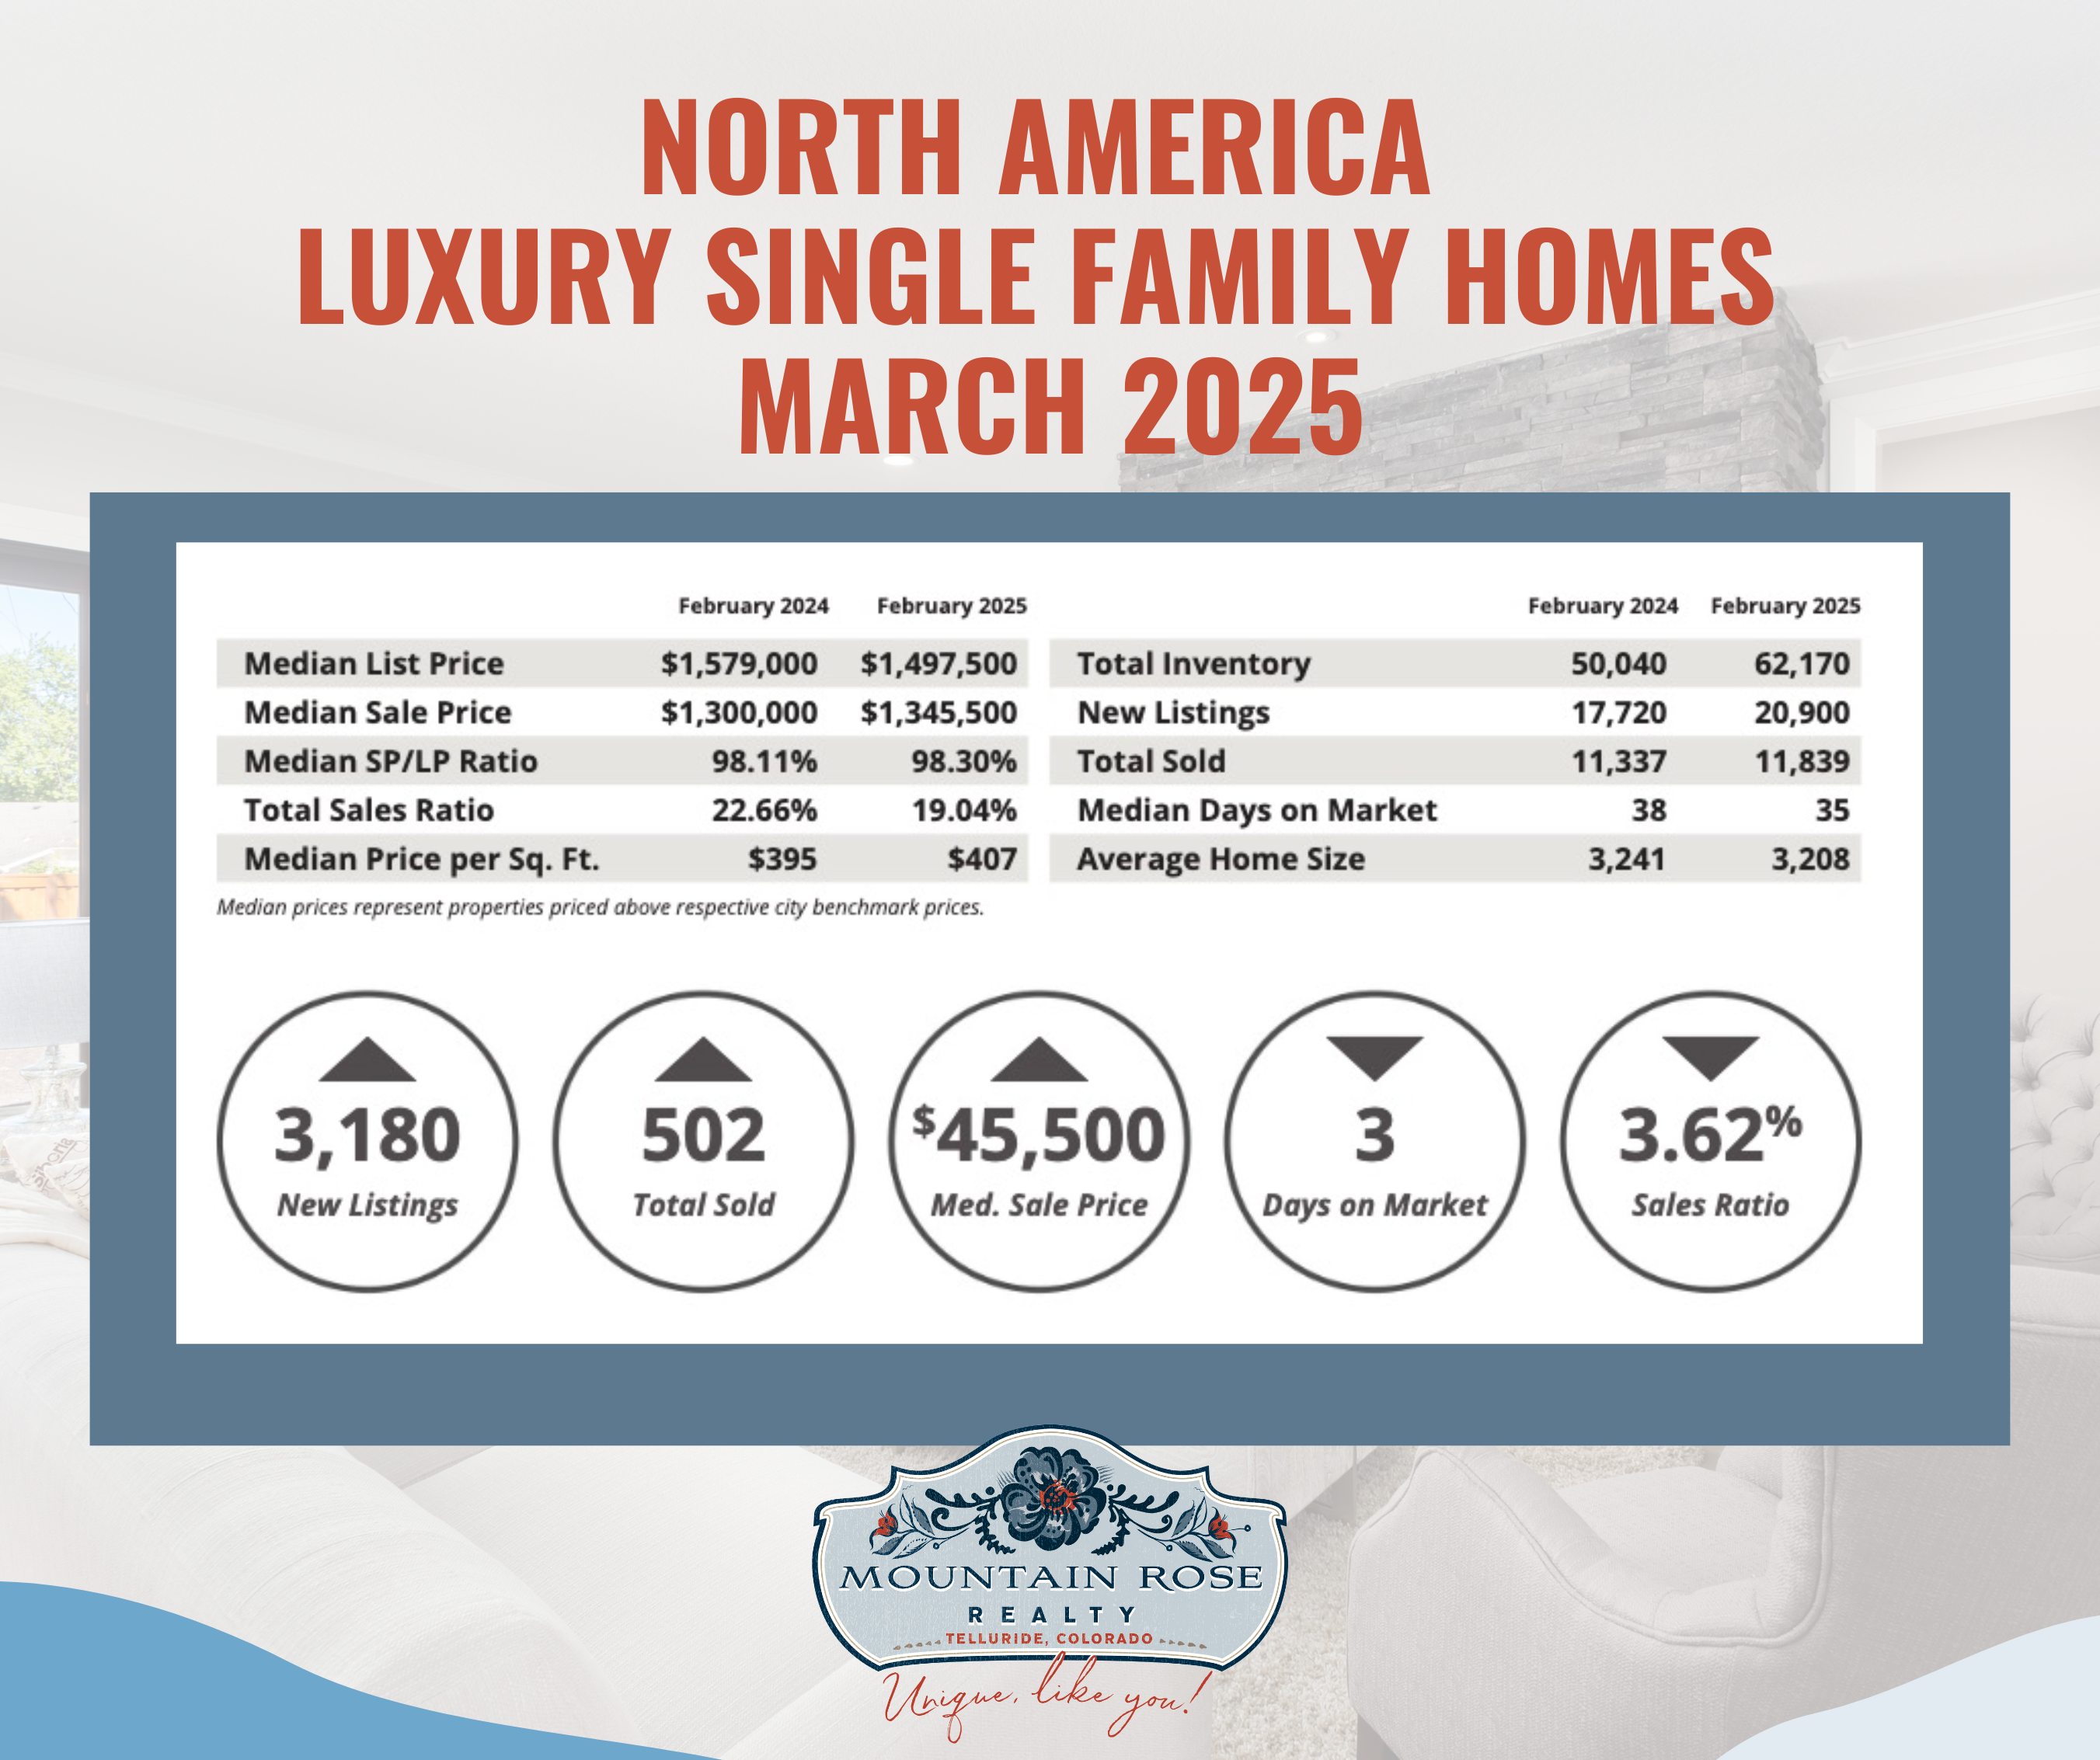
The graphic prints a 19.04% sales ratio, a $1,345,500 median sale price and a 98.30% median SP/LP ratio. The original narrative classified the category as balanced and reported a $900,000 median luxury threshold. The original prose’s average SP/LP wording is corrected to the chart’s median label.
The original summary named median sale prices of Pitkin County $17,471,974; Telluride $5,492,500; Eagle County $4,850,000; and South Walton $4,825,000. Its high sales ratios were East Bay 70.9%; Seattle 57.2%; King County 49.2%; and Baltimore City 46.2%. The Telluride figure describes the report’s historical luxury single-family category, not all local housing or a current asking price. The North America graphic does not show the underlying local transaction counts.
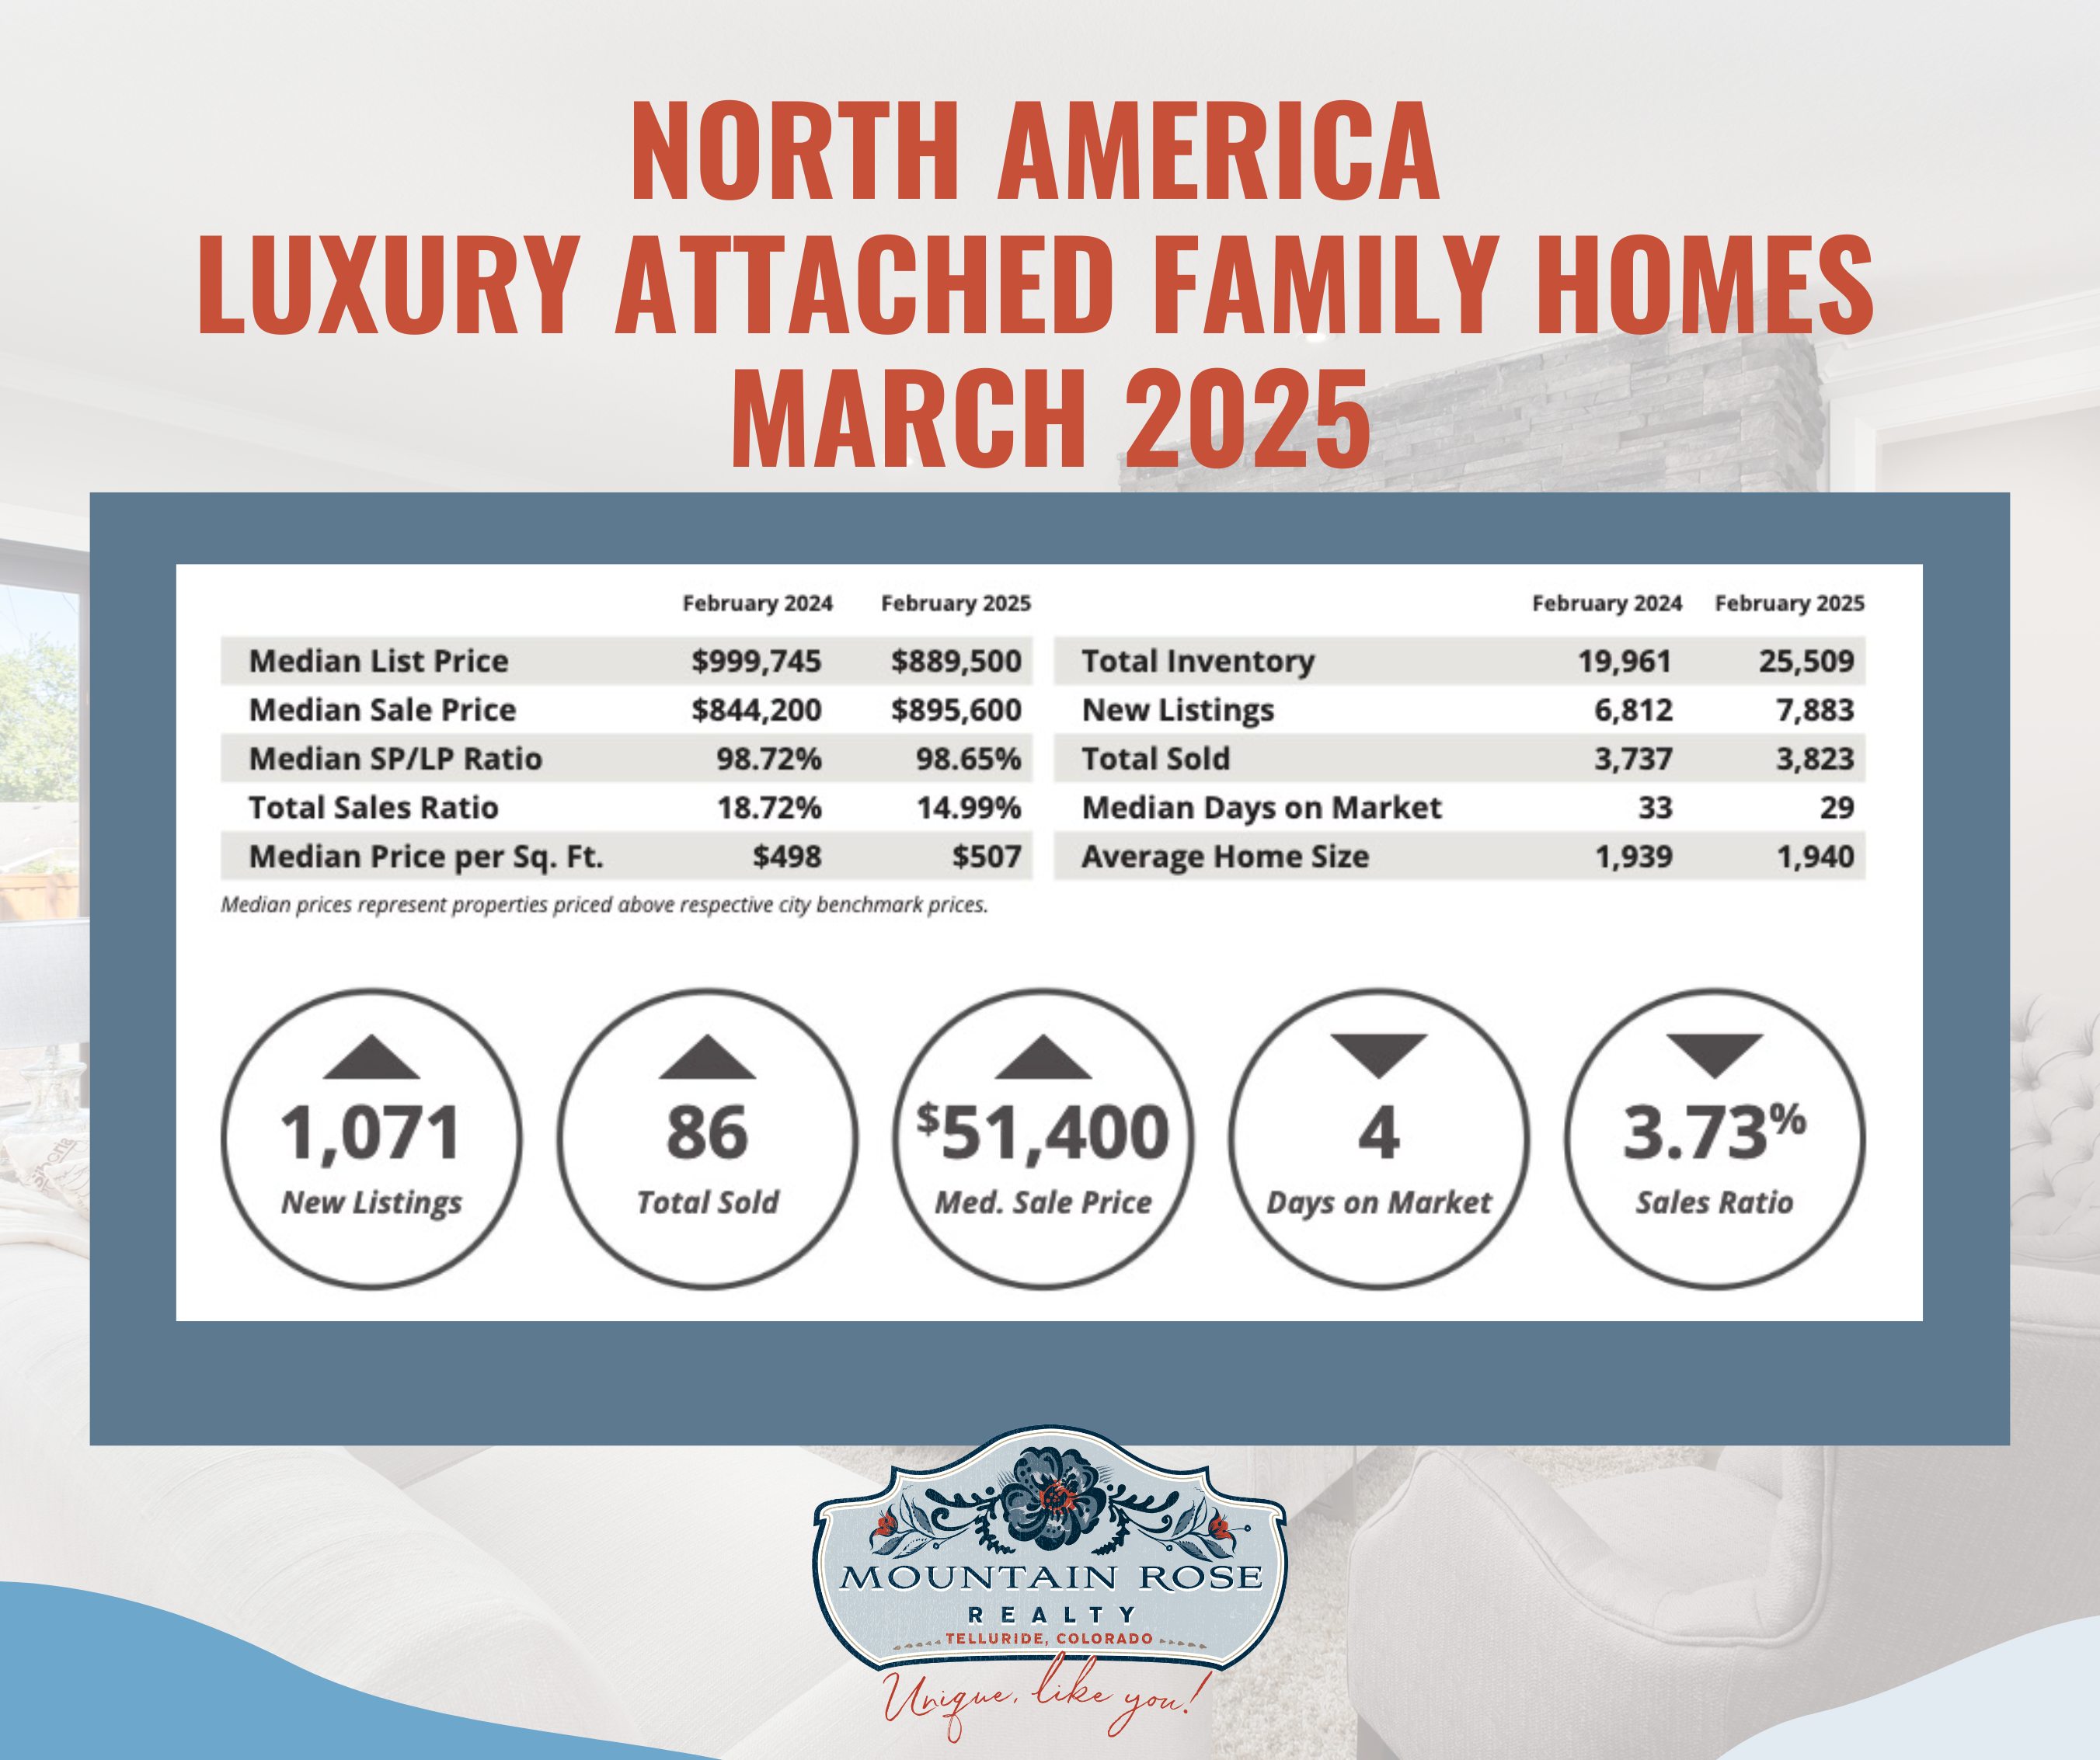
The original summary reported a balanced category with a 14.99% sales ratio, a $700,000 median luxury threshold and an $895,600 median sale price. Its retained graphic labels the 98.65% SP/LP statistic as a median.
Named high median sale prices were Sonoma County $3,500,000; Park City $3,370,000; Whistler $3,160,000; and Pitkin County $3,150,000. Named sales ratios were Howard County, Maryland 90.3%; Fairfax County, Virginia 89.4%; Arlington and Alexandria, Virginia 71.2%; and Silicon Valley 60.3%. These comparisons keep attached properties separate from single-family homes.
The original commentary discussed interest rates, economic uncertainty, cash purchasing, inventory, generational turnover, sustainability and smart-home features. Those may be useful discussion topics, but the supplied charts do not identify buyers’ ages, motives or financing, prove that lower rates caused activity, or show that a single property type was preferred by all luxury buyers.
The discussion also contrasted Toronto and Vancouver with U.S. markets ranging from New York apartments to Texas ranches, and raised foreign-buyer rules, taxes and investment restrictions. Rules vary by country, province, state and transaction and can change. This historical summary is not a current legal or tax comparison; obtain current jurisdiction-specific advice rather than relying on its broad claim that one country is more flexible or its unsupported generalization about family-driven purchases.
The original article attributed a 60% decline in global real estate investment since 2021 to Knight Frank’s Wealth Report. It did not identify the edition, ending period, investment category or calculation behind that figure. It is retained here as an unresolved source claim, not as a verified measure of global residential sales or Telluride demand.
The same commentary discussed private capital, future London office requirements, housing supply in major cities and build-to-rent activity in Tokyo, Paris and Sydney. Office investment, rental development and residential resale are different markets; those examples cannot establish a Telluride price trend without relevant local evidence. Nor does the reported $5,492,500 Telluride median demonstrate strong demand for every ski-in/ski-out home, retreat or custom estate.
These figures concern the report’s selected luxury markets and price bands. A median can change because a different mix of homes sold; it does not measure appreciation of the same property. Report sales ratios are separate from sale-price-to-list-price ratios, and neither guarantees a particular home’s selling time or negotiation outcome. For a present Telluride inquiry, compare recent local transactions, active competition, property condition, location and contract terms. Contact Mountain Rose Realty to discuss that property-specific evidence.