

August 2026 report archive, covering July 2026. The two original graphics compare July 2025 and July 2026 across the report’s North America luxury categories. The original article did not supply a full-report or methodology link. Its named-market figures remain attributed to that historical summary; the charts below provide the visible aggregate comparisons.
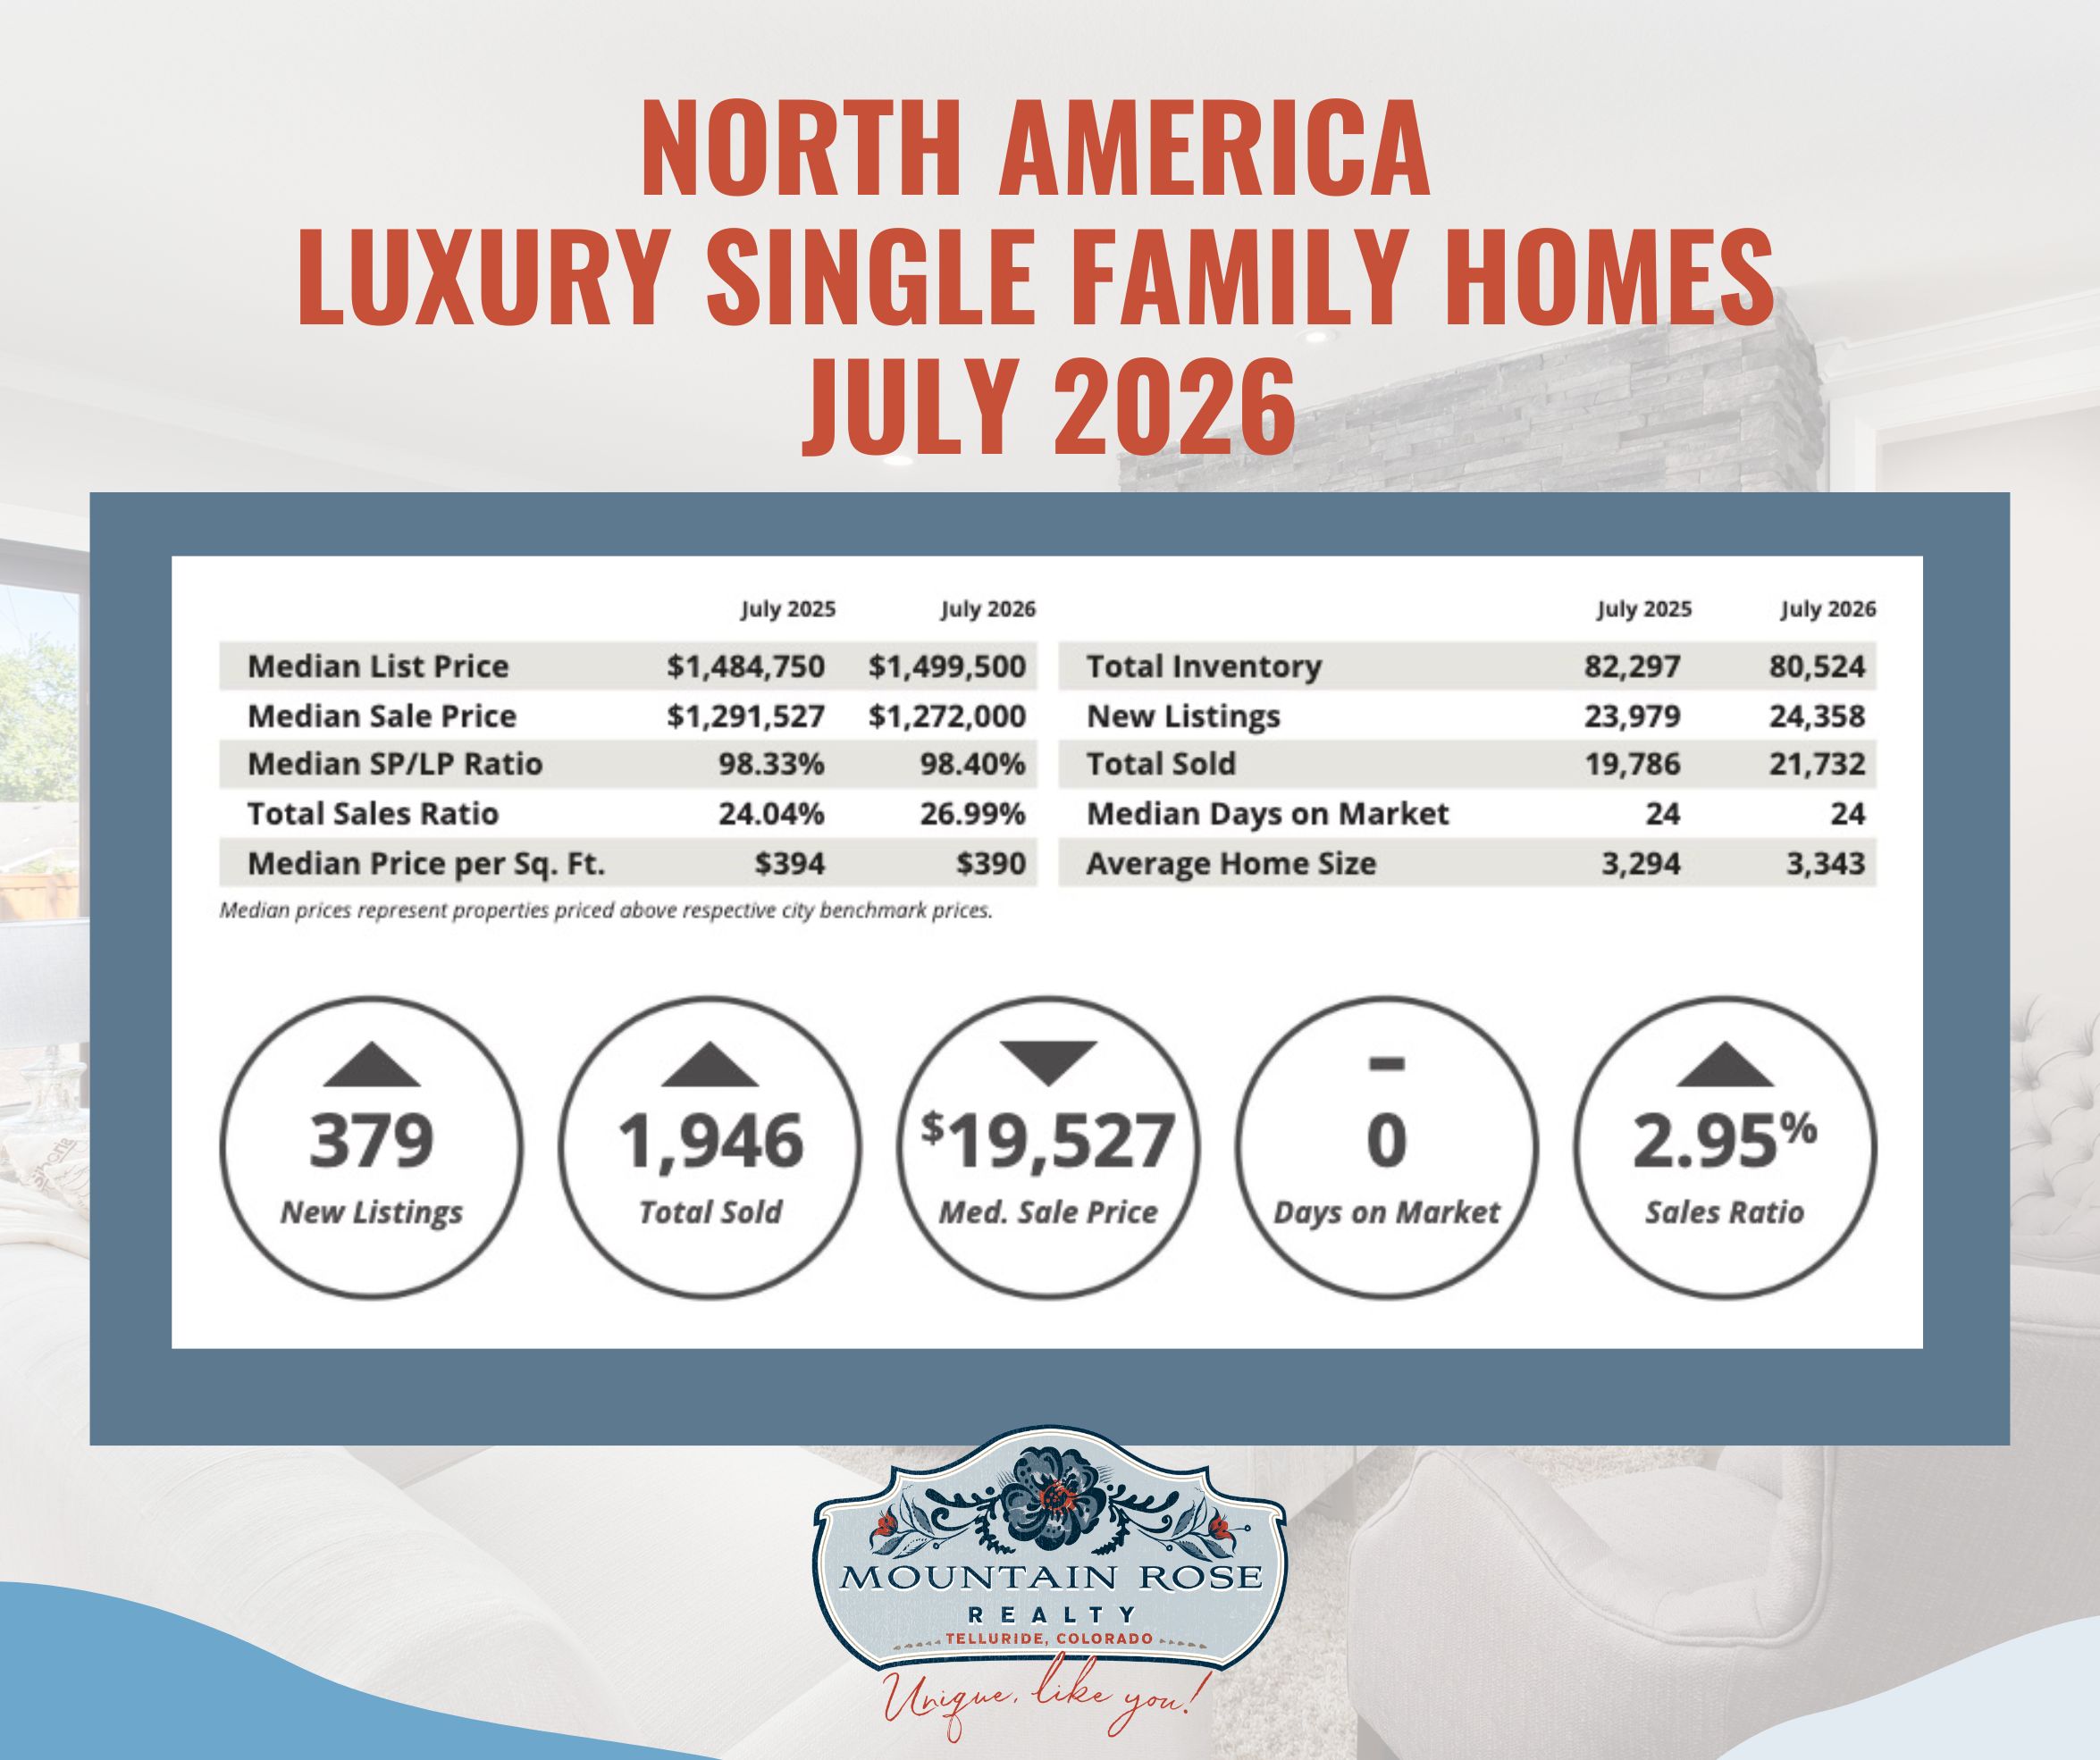
The graphic prints total sold of 19,786 in July 2025 and 21,732 in July 2026, an increase of 1,946, or about 9.8%. Inventory is 82,297 and 80,524, a decrease of about 2.2%. New listings are 23,979 and 24,358, an increase of 379, or about 1.6%. Sales grew while the inventory snapshot fell; those facts do not identify the motives of either buyers or sellers.
Median sale price is $1,291,527 and $1,272,000, a decrease of $19,527. Median days on market are 24 in both columns. The sales ratio rises from 24.04% to 26.99%, a 2.95-percentage-point difference, while median SP/LP rises from 98.33% to 98.40%. The original prose called SP/LP an average; the table labels it a median. The circular annotations show changes between columns, not the actual sale price or number of days on market.
The original summary reported a $912,500 median luxury threshold and a seller’s-market classification. Its listed high median sale prices were Telluride $9,500,000; Silicon Valley $5,780,000; Eagle County $4,850,000; and Paradise Valley $4,600,000. Its named sales ratios were San Francisco 150.8%; Howard County 96.5%; Central Connecticut 92.0%; and Marin County 84.5%. The underlying local sample sizes are not supplied here. Telluride’s reported median does not by itself establish scarcity, global demand, appreciation or the value of another home.

The attached graphic prints total sold of 4,462 and 5,139, an increase of 677, or about 15.2%. Inventory changes from 27,405 to 26,091, about 4.8% lower. New listings change from 7,129 to 7,089, a decrease of 40, or about 0.6%. Thus the 9.8% and 15.2% figures in the original article refer to increased sales, not declining inventory.
Median sale price changes from $872,000 to $870,000, a $2,000 decrease, and median days on market from 34 to 31. Sales ratio rises from 16.28% to 19.70%, a 3.42-percentage-point difference; median SP/LP rises from 98.23% to 98.42%. The original narrative reported a $700,000 median luxury threshold and a balanced classification. Named high median prices were Maui $2,962,500; San Francisco $2,500,000; Naples $2,487,500; and Whistler $2,193,000. Named sales ratios were San Francisco 104.3%; Morris County 96.9%; Marin County 65.4%; and Arlington and Alexandria 62.5%.
The article’s stated sales-ratio bands were below 12% for buyer’s, 12% to under 21% for balanced, and at least 21% for seller’s. Those are the report’s classification bands. Ratios above 100% require checking which sales period and inventory snapshot the publisher used; they do not mean a property sold above asking. The graphics state that median prices cover properties above each city’s benchmark, so different local thresholds also affect comparisons.
The original narrative said sales were lower than June and single-family new listings posted their first year-over-year increase of 2026. The two July comparisons do not verify either the month-over-month statement or the full-year sequence. Nor do they establish summer seasonality as the cause of a change.
Location, condition, architecture, privacy, acreage, views, ski access, walkability, multigenerational layouts and daily amenities can all help define a search. In Telluride, also examine sun exposure, redevelopment constraints and the actual route to town. In Mountain Village, review the lot, construction, association obligations and distance to the Village Core or a usable ski access point. These are property-specific questions, not guarantees that an “exceptional” home attracts strong offers or that a dated home must linger.
The original commentary discussed liquidity, portfolios, equity, cash purchasing, financing alternatives and long investment horizons. It also suggested younger buyers favored wellness, technology, remote work, recreation and experiences. The supplied charts do not measure wealth, generations or preferences. A home’s personal utility, carrying costs and financial risk should be assessed separately from a general claim of wealth preservation or long-term security.
New listings, closed sales, days on market, price reductions and consistently defined sales ratios are useful follow-up measures. Compare equivalent locations, price bands, property types and periods. Rising listings alone does not prove seller confidence; longer marketing time alone does not identify a mismatch in quality; and stronger aggregate sales does not promise an individual seller a premium. A future trend requires additional observations, not just July’s results.
Report categories and medians describe groups of transactions. They do not measure appreciation of the same homes, establish why buyers acted or determine a particular property’s value. Sales ratio is distinct from sale-price-to-list-price ratio; the inventory denominator and timing matter when interpreting it. Compare recent local sales, active listings, condition, access, location and contract terms for a present decision. Contact Mountain Rose Realty to discuss the evidence for your property and plans.