

October 2024 report archive, covering September 2024. The original article presented a 24-page North America report for Telluride and other U.S. and Canadian markets. Its report link and graphics remain here. The charts compare September 2023 with September 2024.
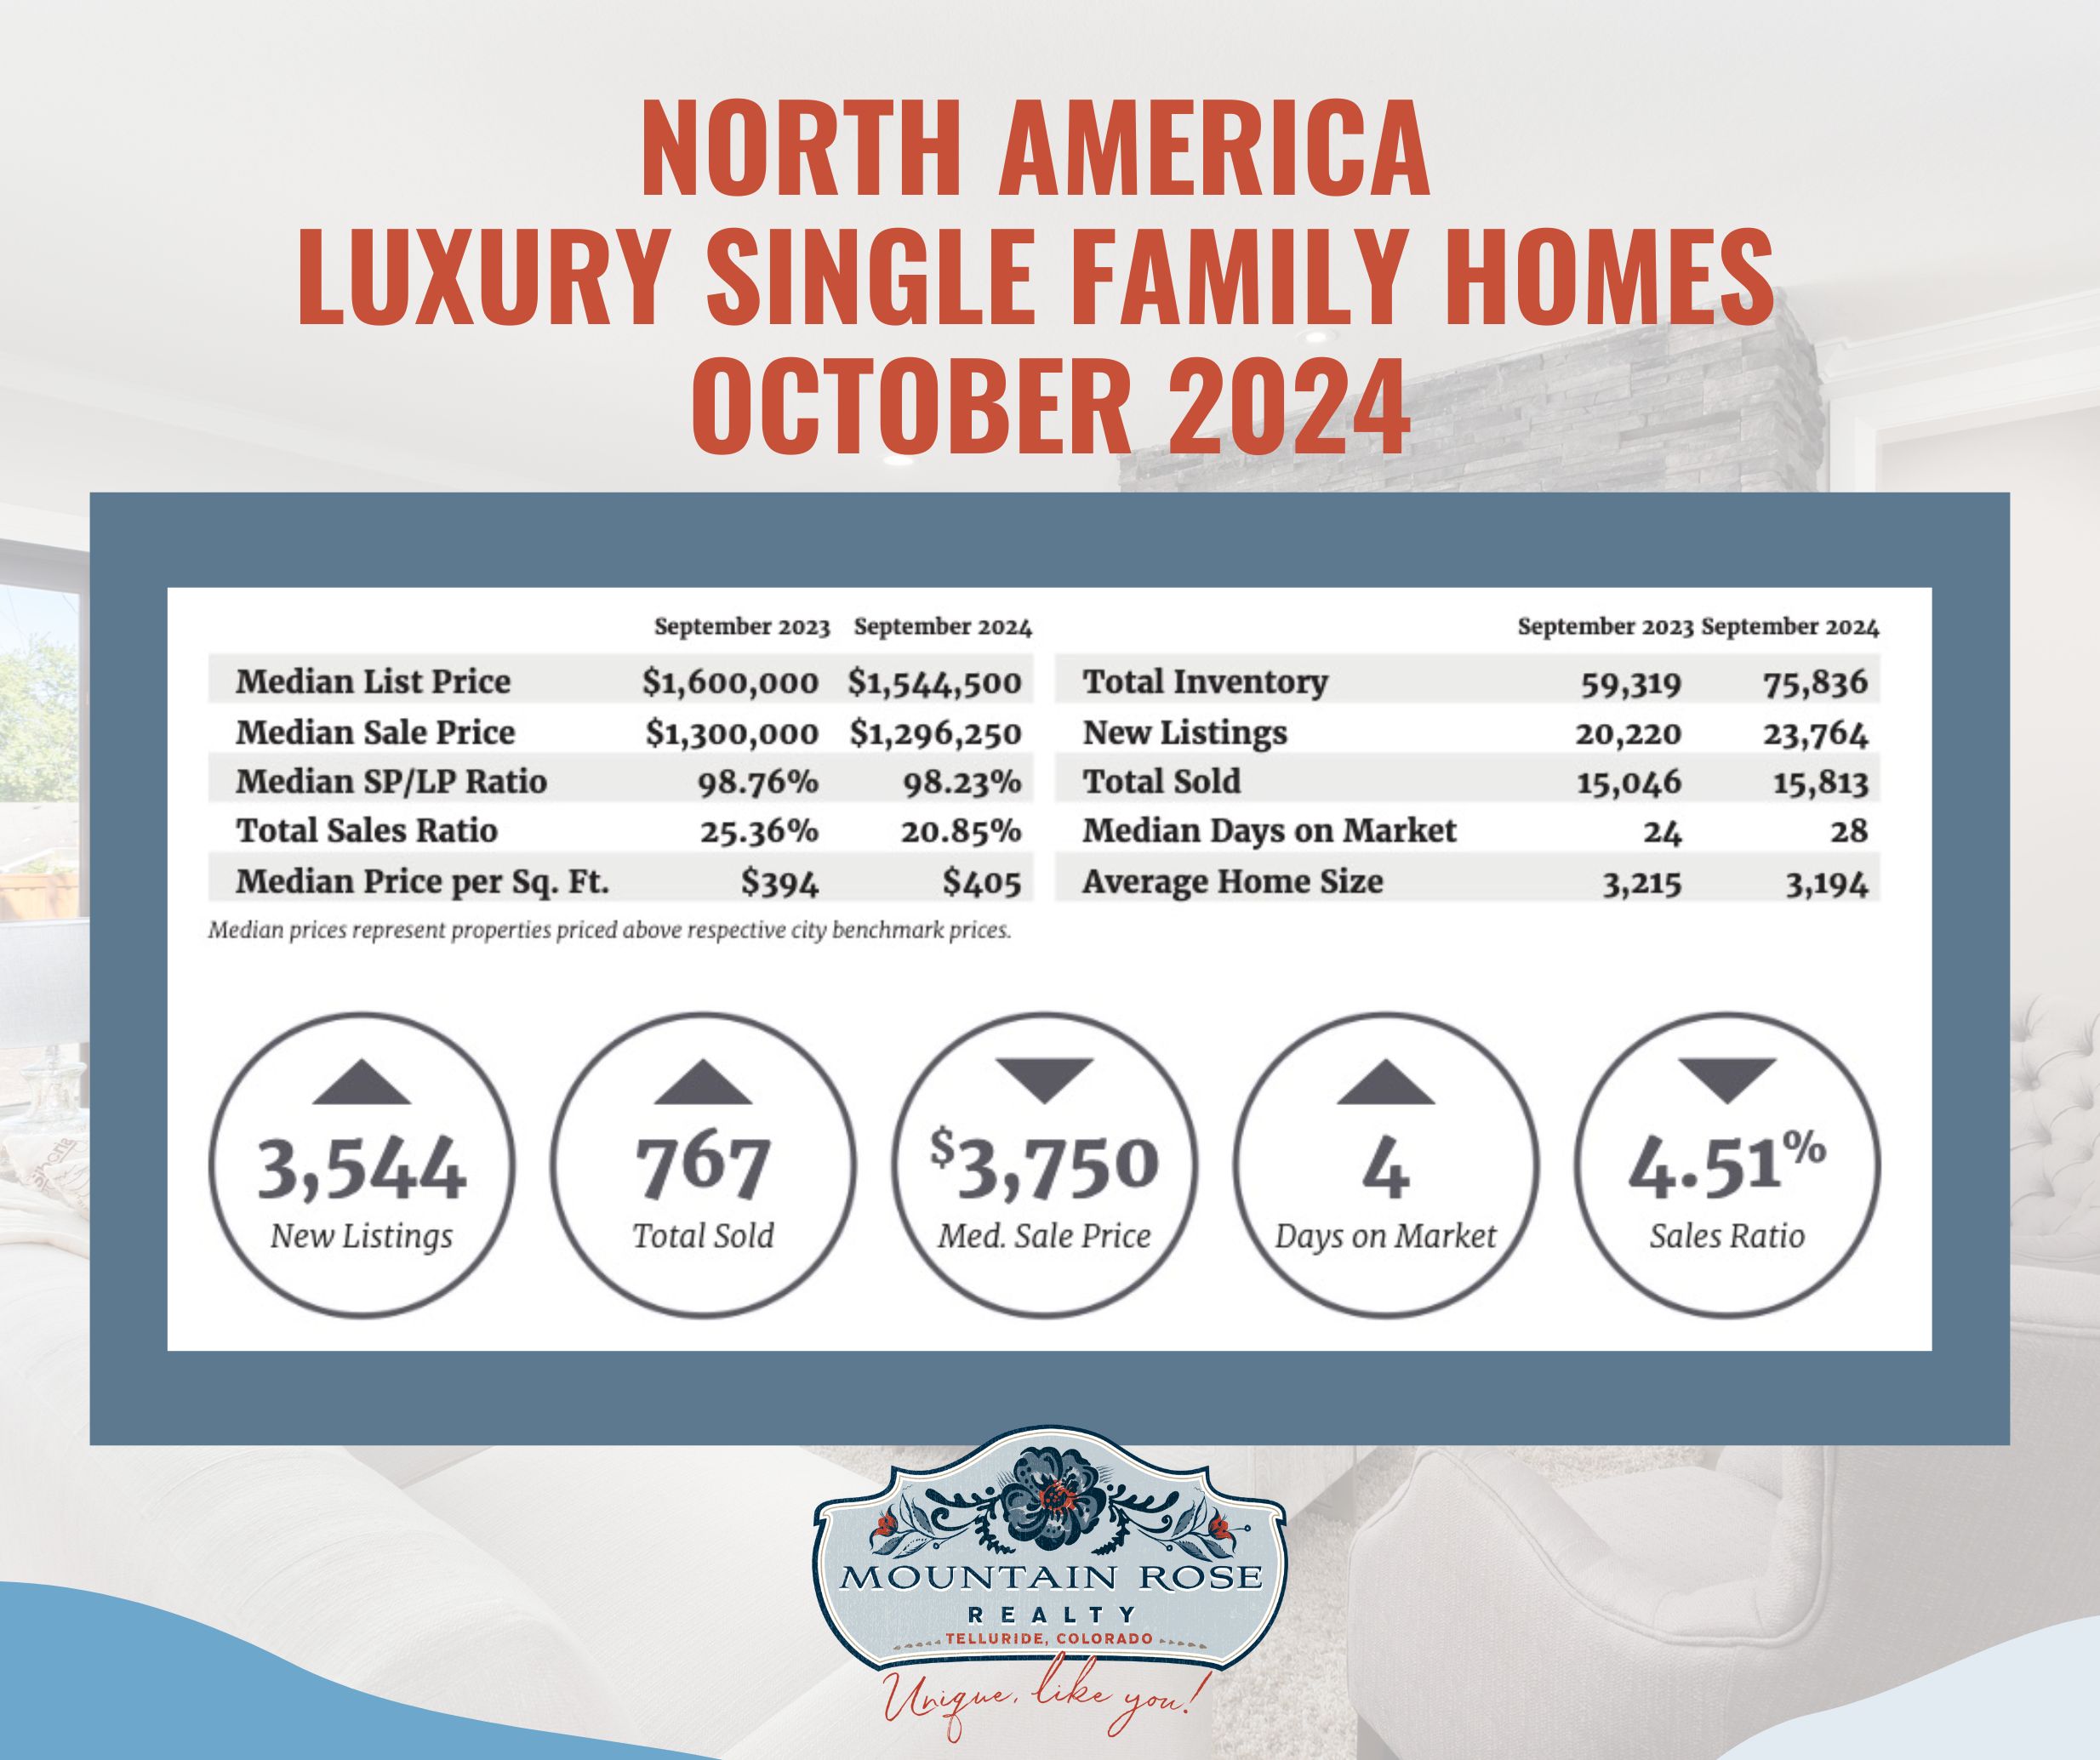
The September 2024 chart prints a 20.85% sales ratio, a $1,296,250 median sale price and a 98.23% median SP/LP ratio. The original narrative described the category as balanced and reported a $900,000 median luxury threshold. Its reference to an average sold-to-list result has been corrected to the table’s median label.
The narrative’s named median sale prices were Telluride $5,304,000; Vail $5,200,000; Naples $3,900,000; and Los Angeles Beach Cities $3,875,000. These are the original summary’s local category figures; calling the Telluride number an “average” or a universal local value would change its meaning. The aggregate image does not show the local samples.
New listings rise from 20,220 to 23,764, consistent with the original 17.52% year-over-year increase. That is a change in new listings, not total inventory. Total inventory separately rises from 59,319 to 75,836; sold counts from 15,046 to 15,813. Median sale price changes from $1,300,000 to $1,296,250 and median days on market from 24 to 28.

The chart’s September 2024 sales ratio is 16.42%; the original prose’s 16.24% reverses two digits. The chart prints a median sale price of $852,000 and median SP/LP of 98.65%. The original narrative classified the category as balanced and reported a $700,000 median luxury threshold.
Named high median prices in the original summary were Vail $3,050,000; Whistler $2,850,000; Sarasota and Beaches $2,565,100; and San Francisco $2,475,000. Its named sales ratios were Fairfax County 83.6%; Anne Arundel County 73.0%; and Arlington and Alexandria 65.4%. These are historical local claims, separate from the North America table.
Attached inventory rises from 19,060 to 25,099, about 31.7%, and new listings from 7,108 to 8,164, about 14.9%. Neither comparison reproduces the original 18.31% inventory-growth claim. Sold counts fall from 4,309 to 4,122, about 4.3% year-over-year. The original wording described a 4.22% decline “compared to single-family homes”; its denominator is unclear and does not match that table calculation. The literal counts and their own comparison are stated here instead.
The article discussed the pandemic-era combination of low rates, demand and stock-market gains, then predicted a calmer market and said rates were unlikely to return to 2% or 3% for many years. Those were forward-looking judgments in October 2024, not facts established by these housing charts. The charts cannot predict future mortgage rates or identify how any one factor caused the sales results.
A balanced category also does not mean every buyer and seller has equal negotiating power or faces reduced urgency. Terms, financing, property condition and the alternatives available to each party can differ. Use the dated report to understand its snapshot, and a current lender quote and current comparable properties for an actual transaction.
Report categories and medians describe groups of transactions. They do not measure appreciation of the same homes, establish why buyers acted or determine a particular property’s value. Sales ratio is distinct from sale-price-to-list-price ratio; the inventory denominator and timing matter when interpreting it. Compare recent local sales, active listings, condition, access, location and contract terms for a present decision. Contact Mountain Rose Realty to discuss the evidence for your property and plans.