

June 11, 2023 market-commentary archive. The original headline responded to late-2022 forecasts and early-2023 national index readings. It is not an assessment of all of 2023, every local market or present prices. A few improving monthly readings cannot establish that every forecast was wrong or that prices will keep rising.
The article cited Jeremy Siegel’s expectation of a 10%–15% decline, Mark Zandi’s conditional near-10% peak-to-trough national decline if mortgage rates stayed near 6.5% and recession was avoided, and a 20% decline under his recession scenario. It also linked Goldman Sachs commentary discussing a modeled 5%–10% fall from the peak and downside risks. These were different forecasts with different conditions and horizons, not interchangeable predictions about Telluride.
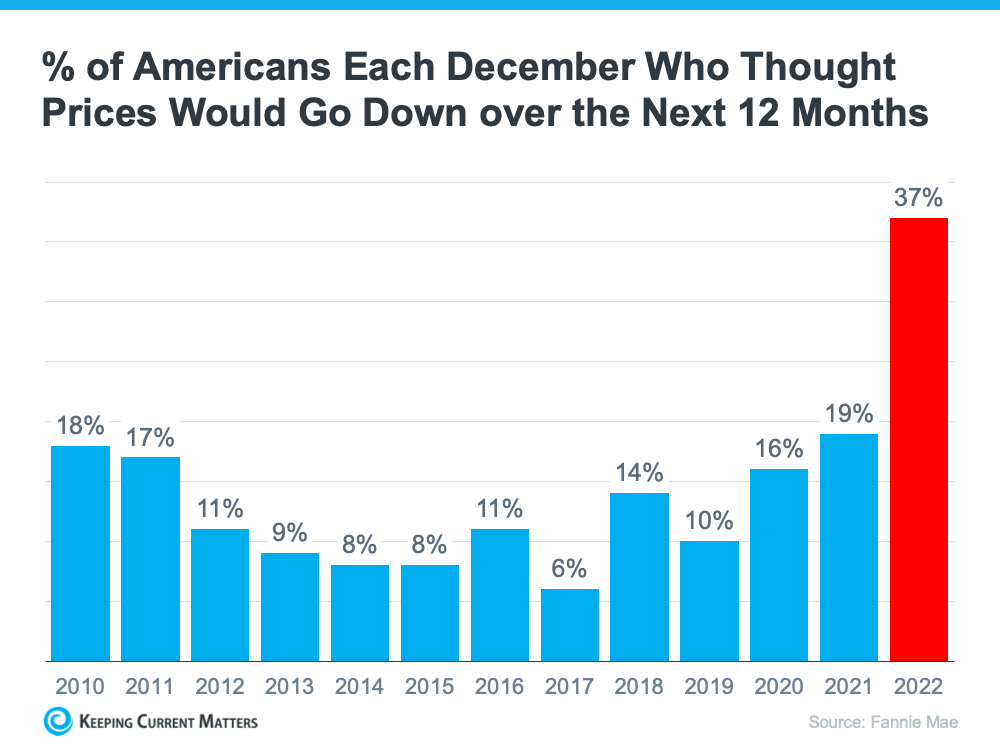
The original Keeping Current Matters graphic, credited to Fannie Mae, shows the share expecting prices to decline over the next 12 months in each December from 2010 through 2022: 18%, 17%, 11%, 9%, 8%, 8%, 11%, 6%, 14%, 10%, 16%, 19% and 37%. The 2022 reading is the highest of those displayed December observations. That is narrower than saying the share was the highest at any time in the survey’s history.
The original Fannie Mae survey link supplies source context. The chart does not show that particular economists caused respondents’ views or that those views caused delayed purchases. It also does not measure actual home-price changes.
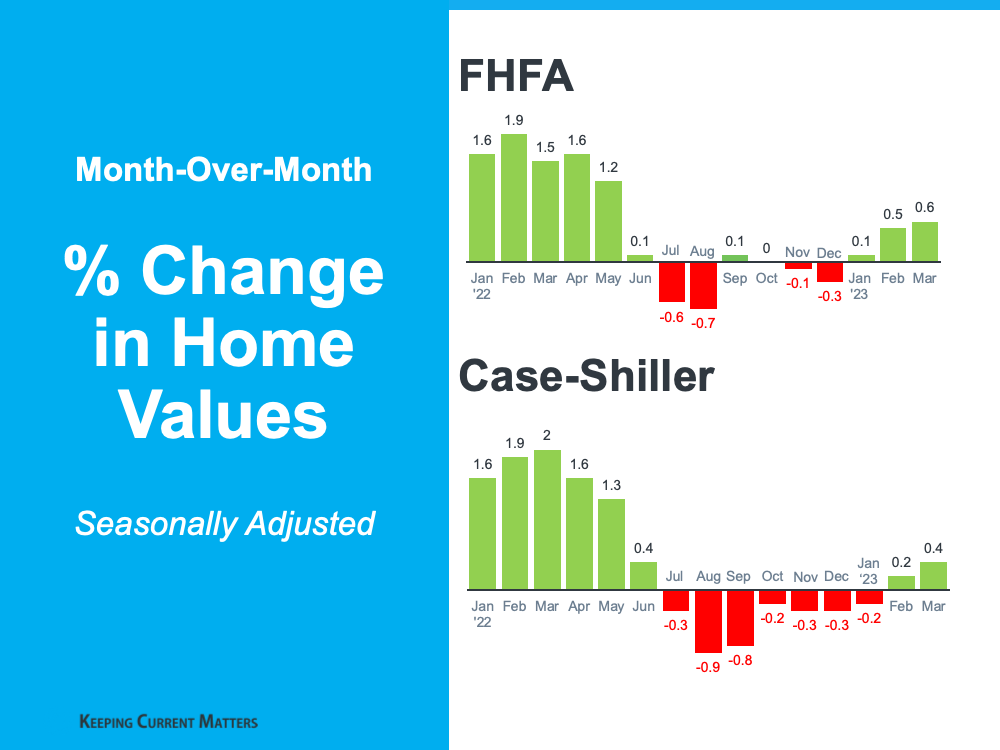
The second graphic labels its figures as seasonally adjusted month-over-month changes. It shows FHFA and Case-Shiller readings from January 2022 through March 2023. For January, February and March 2023, the FHFA bars are 0.1%, 0.5% and 0.6%; Case-Shiller is −0.2%, 0.2% and 0.4%. Both series include declines during the second half of 2022. Positive later months describe a change over the preceding month, not a full-year return or a comparison with the prior peak.
The original article also linked Goldman Sachs stabilization commentary, Case-Shiller index information and the FHFA price-index resource. Index coverage, seasonal adjustment, revisions and release date matter. The original linked Case-Shiller page names an unadjusted index, while the embedded graphic says seasonally adjusted; use the corresponding source series before reproducing a calculation.
These national graphics do not establish low current mortgage rates, rising Telluride prices or stronger demand for a particular home. Compare recent closed sales, active alternatives, condition, location and transaction terms for the property in question. For a purchase, compare a current lender quote and total ownership costs with your budget and time horizon.
Contact Mountain Rose Realty to discuss current local comparables. A historical national chart is context for questions, not an investment or negotiation guarantee.