

The word “today” in this article’s title refers to its original 2023 publication. The graphic below shows a historical buyer-showing index. It does not measure current Telluride demand, establish a seller’s market here or guarantee that a property will appreciate.
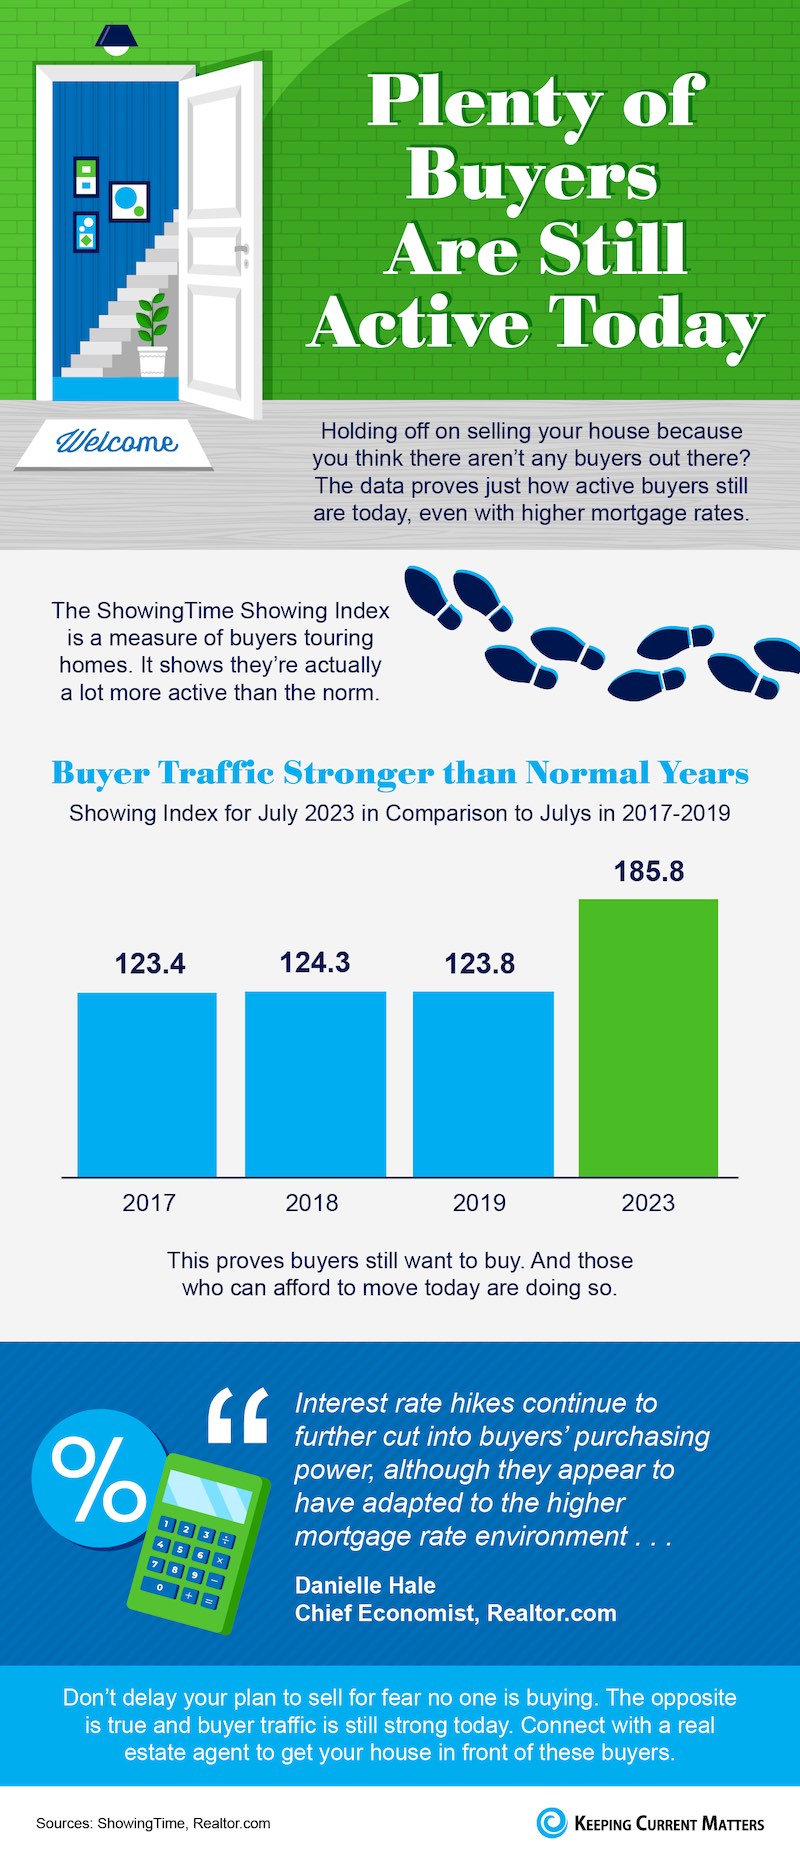
The ShowingTime Showing Index compares July 2023 with July in 2017, 2018 and 2019. Its displayed values are 123.4, 124.3, 123.8 and 185.8, respectively. These are index values, not percentages, sale counts or the number of buyers interested in your house. The graphic credits ShowingTime and Realtor.com; it does not provide a Telluride sample or a complete methodology.
The graphic’s conclusion about stronger traffic than those earlier Julys applies to its reported historical comparison. Danielle Hale’s quoted commentary concerns buyers adapting to mortgage rates at that time. Showing activity is distinct from offers, financing approvals and completed sales, and four selected years do not establish every market’s normal demand.
Ask for a dated comparison of properties relevant to yours: location, home type, price range, size and condition. Look at active competition, recent closed sales, time on market, price changes and available showing or inquiry information. State the period and sample, especially where only a few transactions exist.
Telluride’s landscape, historic setting, skiing, festivals and other recreation may appeal to particular buyers. Those features alone do not demonstrate rising demand, a future sale price or a reliable investment return. Ownership costs, rental restrictions, financing and your intended use also matter.
If you are hesitating to sell, separate concerns about broad headlines from the evidence for your listing. Compare a launch now with waiting, including preparation, carrying costs, replacement housing and the likely alternatives buyers will consider. Ask Anne-Britt Ostlund at Mountain Rose Realty for a property-specific review. No dated national graphic can decide that the current market is in every seller’s favor.