
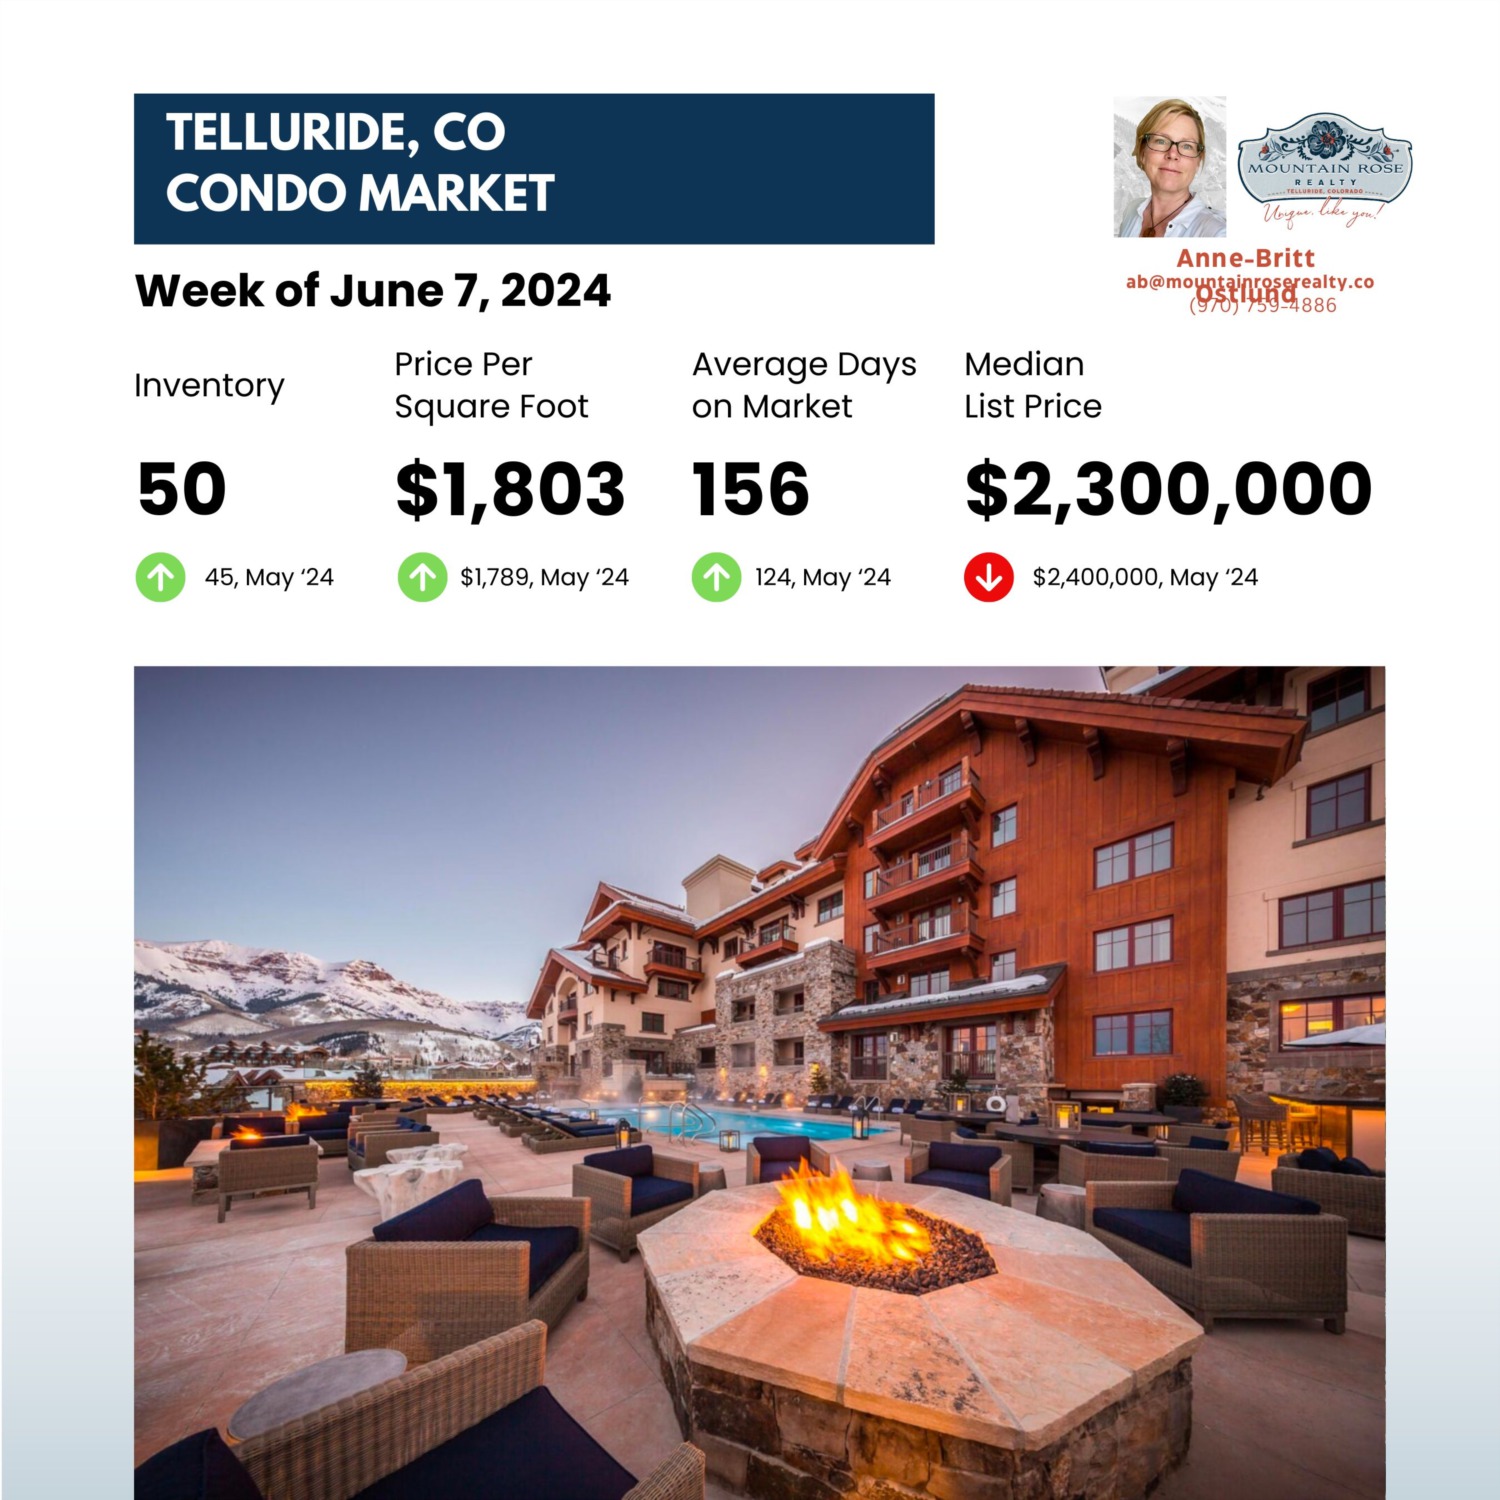
The original lead image contains the market figures for this condo report, titled for the week of June 7, 2024 and published June 6. The figures are transcribed below so readers can use the archive without relying on small text in the graphic.
| Measure | June 7, 2024 graphic | Graphic’s May 2024 comparison |
|---|---|---|
| Inventory | 50 | 45 |
| Price per square foot | $1,803 | $1,789 |
| Average days on market | 156 | 124 |
| Median list price | $2,300,000 | $2,400,000 |
Source: Mountain Rose Realty’s original Telluride condo graphic retained at the top of this article. The smaller reference labels say May 2024; they do not identify an exact May observation date. The graphic does not provide a Market Action Index or a closed-sale series.
Inventory was five listings higher, average days on market was 32 days longer and the median list price was $100,000 lower than the graphic’s May reference. The displayed price per square foot was $14 higher. Those mixed movements describe different measures and can be affected by the types of condos available at each observation.
The source graphic does not document its full sample definition or calculation method. Asking-price statistics do not establish a change in completed-sale values, an individual condo’s appreciation or a rental return. These 2024 figures also cannot answer how much inventory is available today.
Anne-Britt Ostlund at Mountain Rose Realty can help organize a property-specific comparison for a buyer or seller. Start with the condo’s building, size, condition, location and intended use, then review current competing listings, pending sales and recent closed transactions. Association dues, reserves, assessments and use restrictions deserve a separate check.
Contact Anne-Britt Ostlund to discuss your search, or browse the dated market archives with each report’s period in view.