

The August 2026 archive reports July 2026 Telluride luxury-market figures. Its $9.5 million single-family median sale price describes seven reported closings, while the attached-home median describes ten. Those small monthly samples make the headline less useful than a comparison by property type, price band and individual home.
Source: the two Mountain Rose Realty graphics reproduced below and the original accompanying July summary. The graphics compare July 2025 with July 2026; the summary supplies the median labels and price-band figures. No transaction-level export, exact luxury inclusion threshold or mapped market boundary accompanies this archive. Its Telluride reporting area should not be assumed to match only the town limits, the entire ZIP code or a separate Mountain Village dataset.
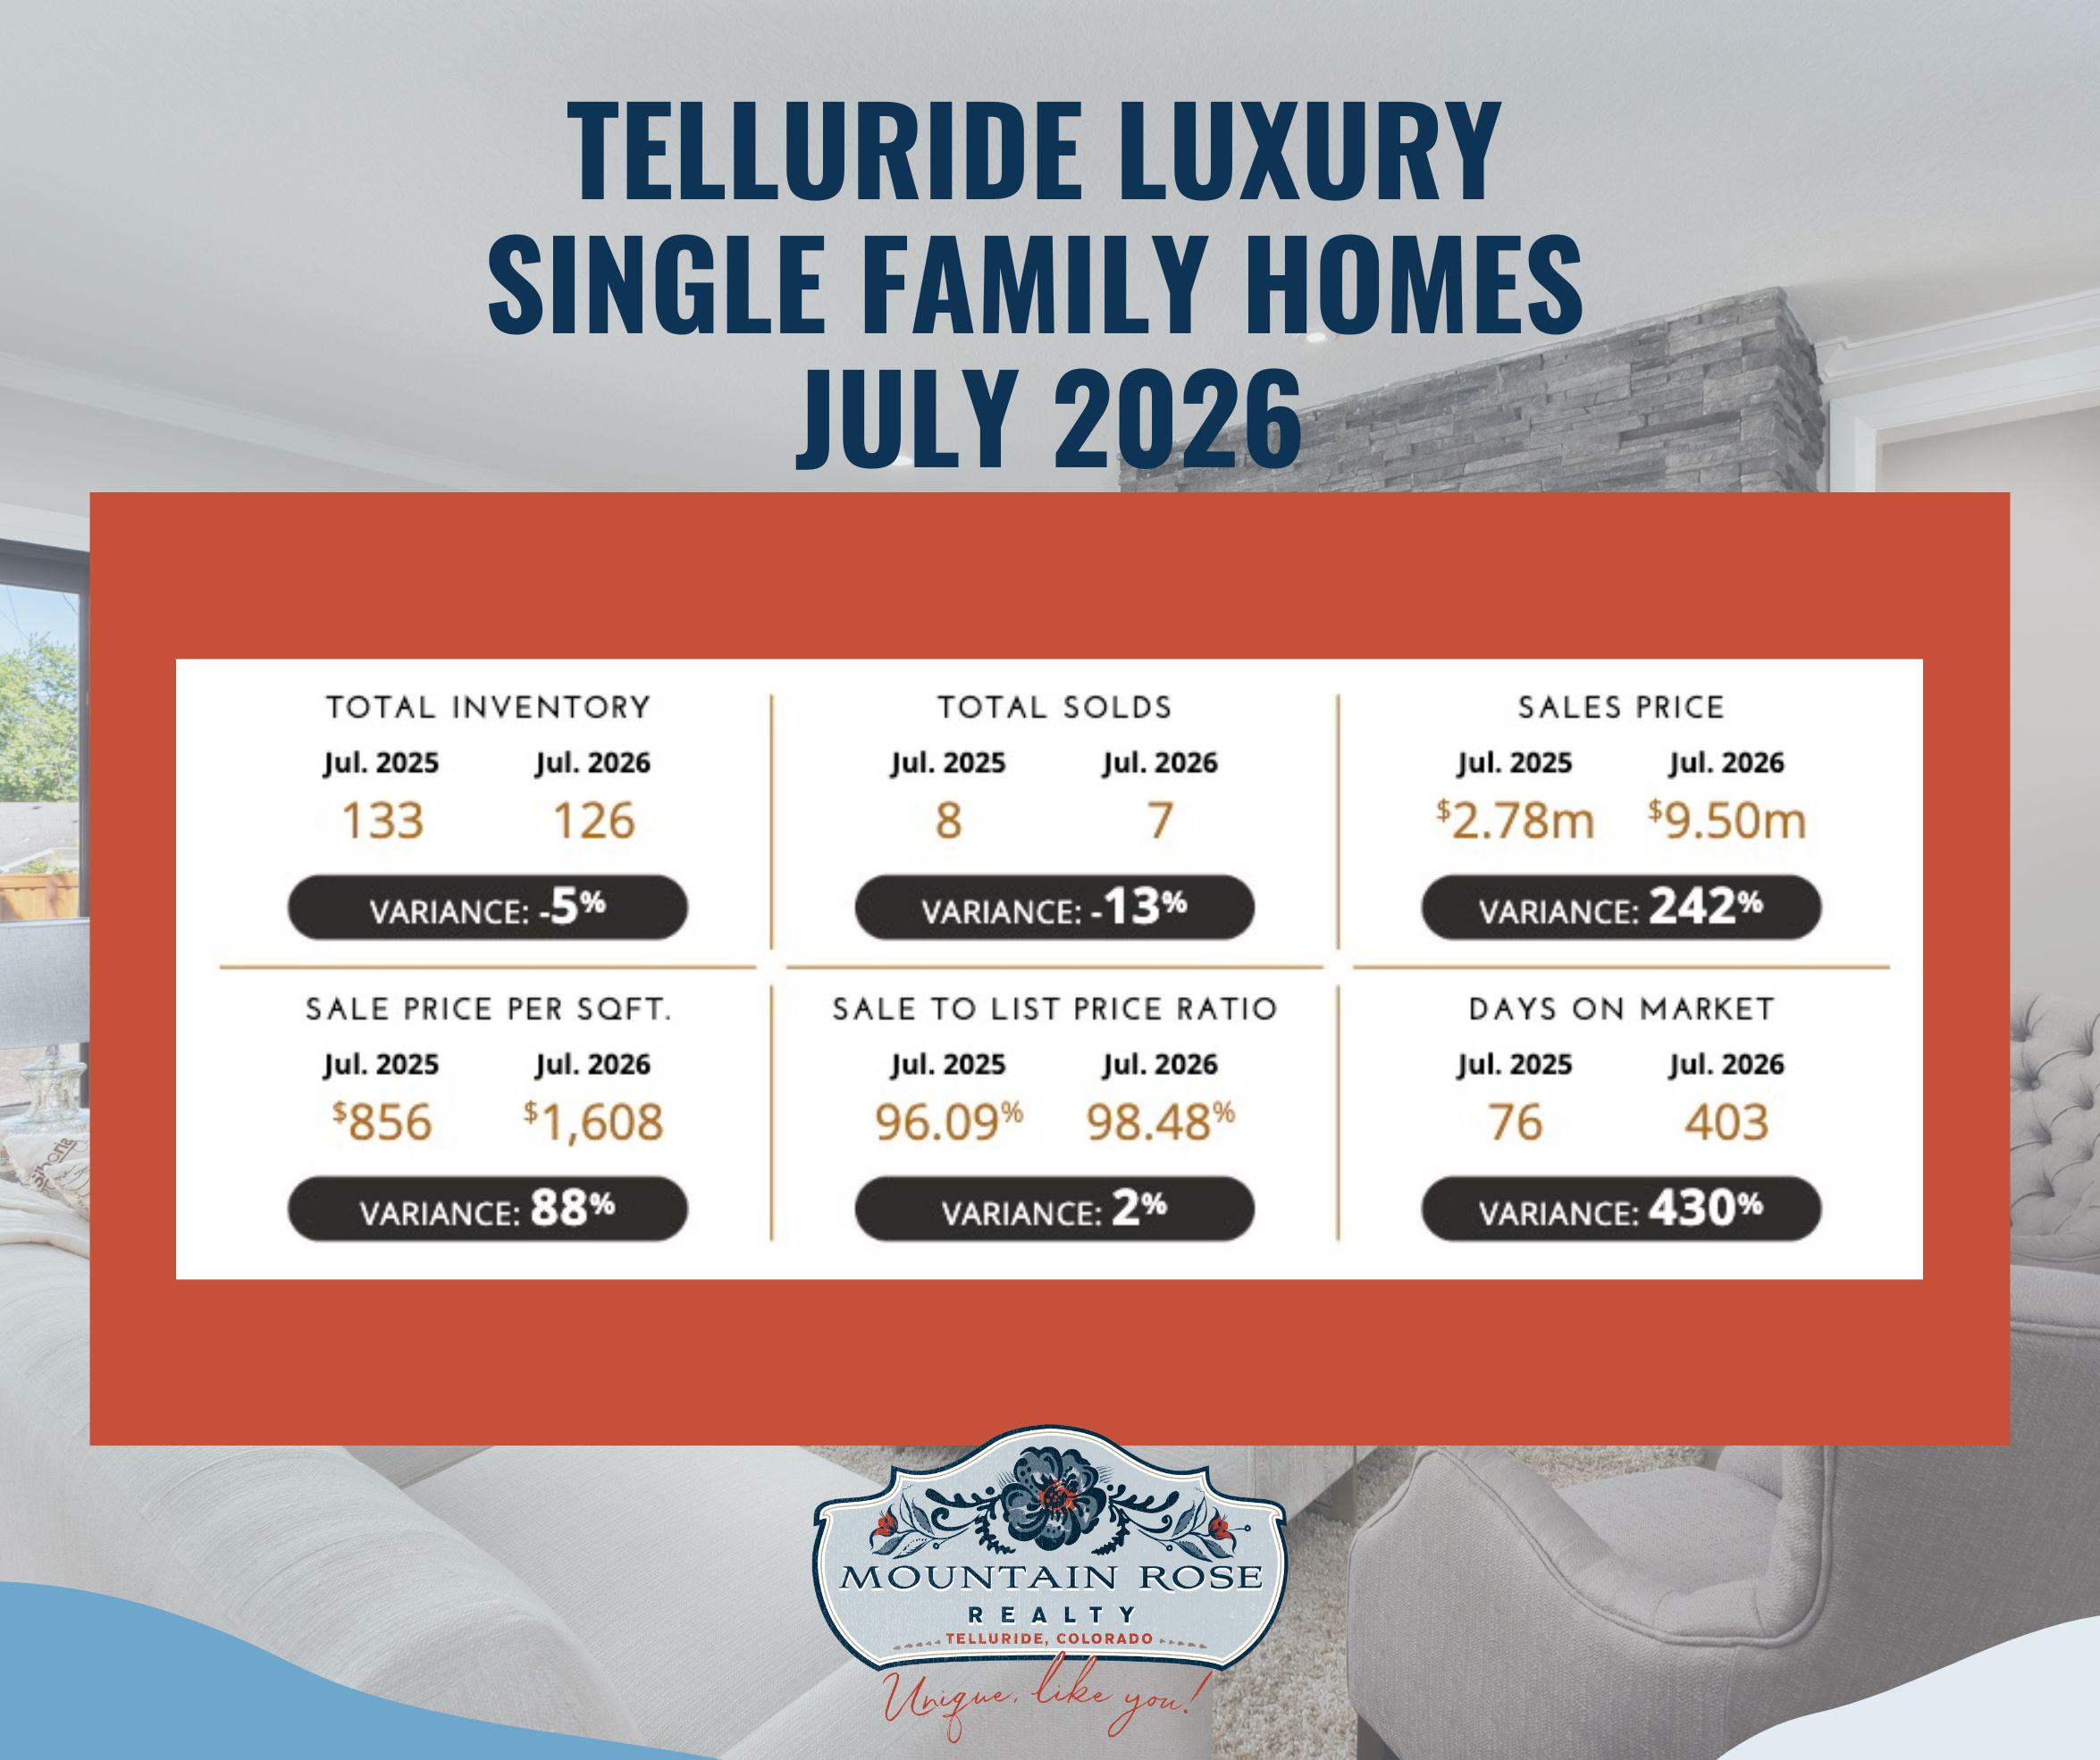
| Measure | July 2025 | July 2026 |
|---|---|---|
| Inventory | 133 | 126 |
| Sales | 8 | 7 |
| Median sales price | $2.78 million | $9.50 million |
| Reported sale price per square foot | $856 | $1,608 |
| Median sale-to-list price ratio | 96.09% | 98.48% |
| Median days on market | 76 | 403 |
The original summary classifies the single-family segment as a buyer’s market, with a rounded 6% sales ratio. Seven sales divided by 126 listed properties is approximately 5.6%. The most active reported price bands were $4,000,000–$4,749,999 and $9,000,000–$9,999,999, each at 25%. Counts for those bands were not supplied, so a high ratio should not be mistaken for a large volume of transactions.
The graphic reports rounded relative changes of −5% in inventory, −13% in sales, +242% in median sales price, +88% in price per square foot and +430% in median days on market. These describe different monthly groups of properties. The sale-to-list ratio rose 2.39 percentage points, from 96.09% to 98.48%; the graphic’s rounded 2% variance is a relative percentage change.
A median is the middle observation after the sales are ordered by price. With seven closings, a different mix of homes can move that midpoint sharply. The reported increase from $2.78 million does not establish that the same home appreciated 242%, that every Telluride home is worth nearly $10 million, or that Telluride ranks at a particular position among all North American markets.
Similarly, a median sale-to-list ratio of 98.48% covers homes that sold. It does not mean every listing sold near asking price or that a buyer can expect a 1.52% discount. The 403-day median describes the marketing time of the reported sales, rather than a promised selling period for a new listing. Compared with 76 days a year earlier, it is a large shift, but the small sample cannot by itself explain buyer motivation or establish a trend for every price band.
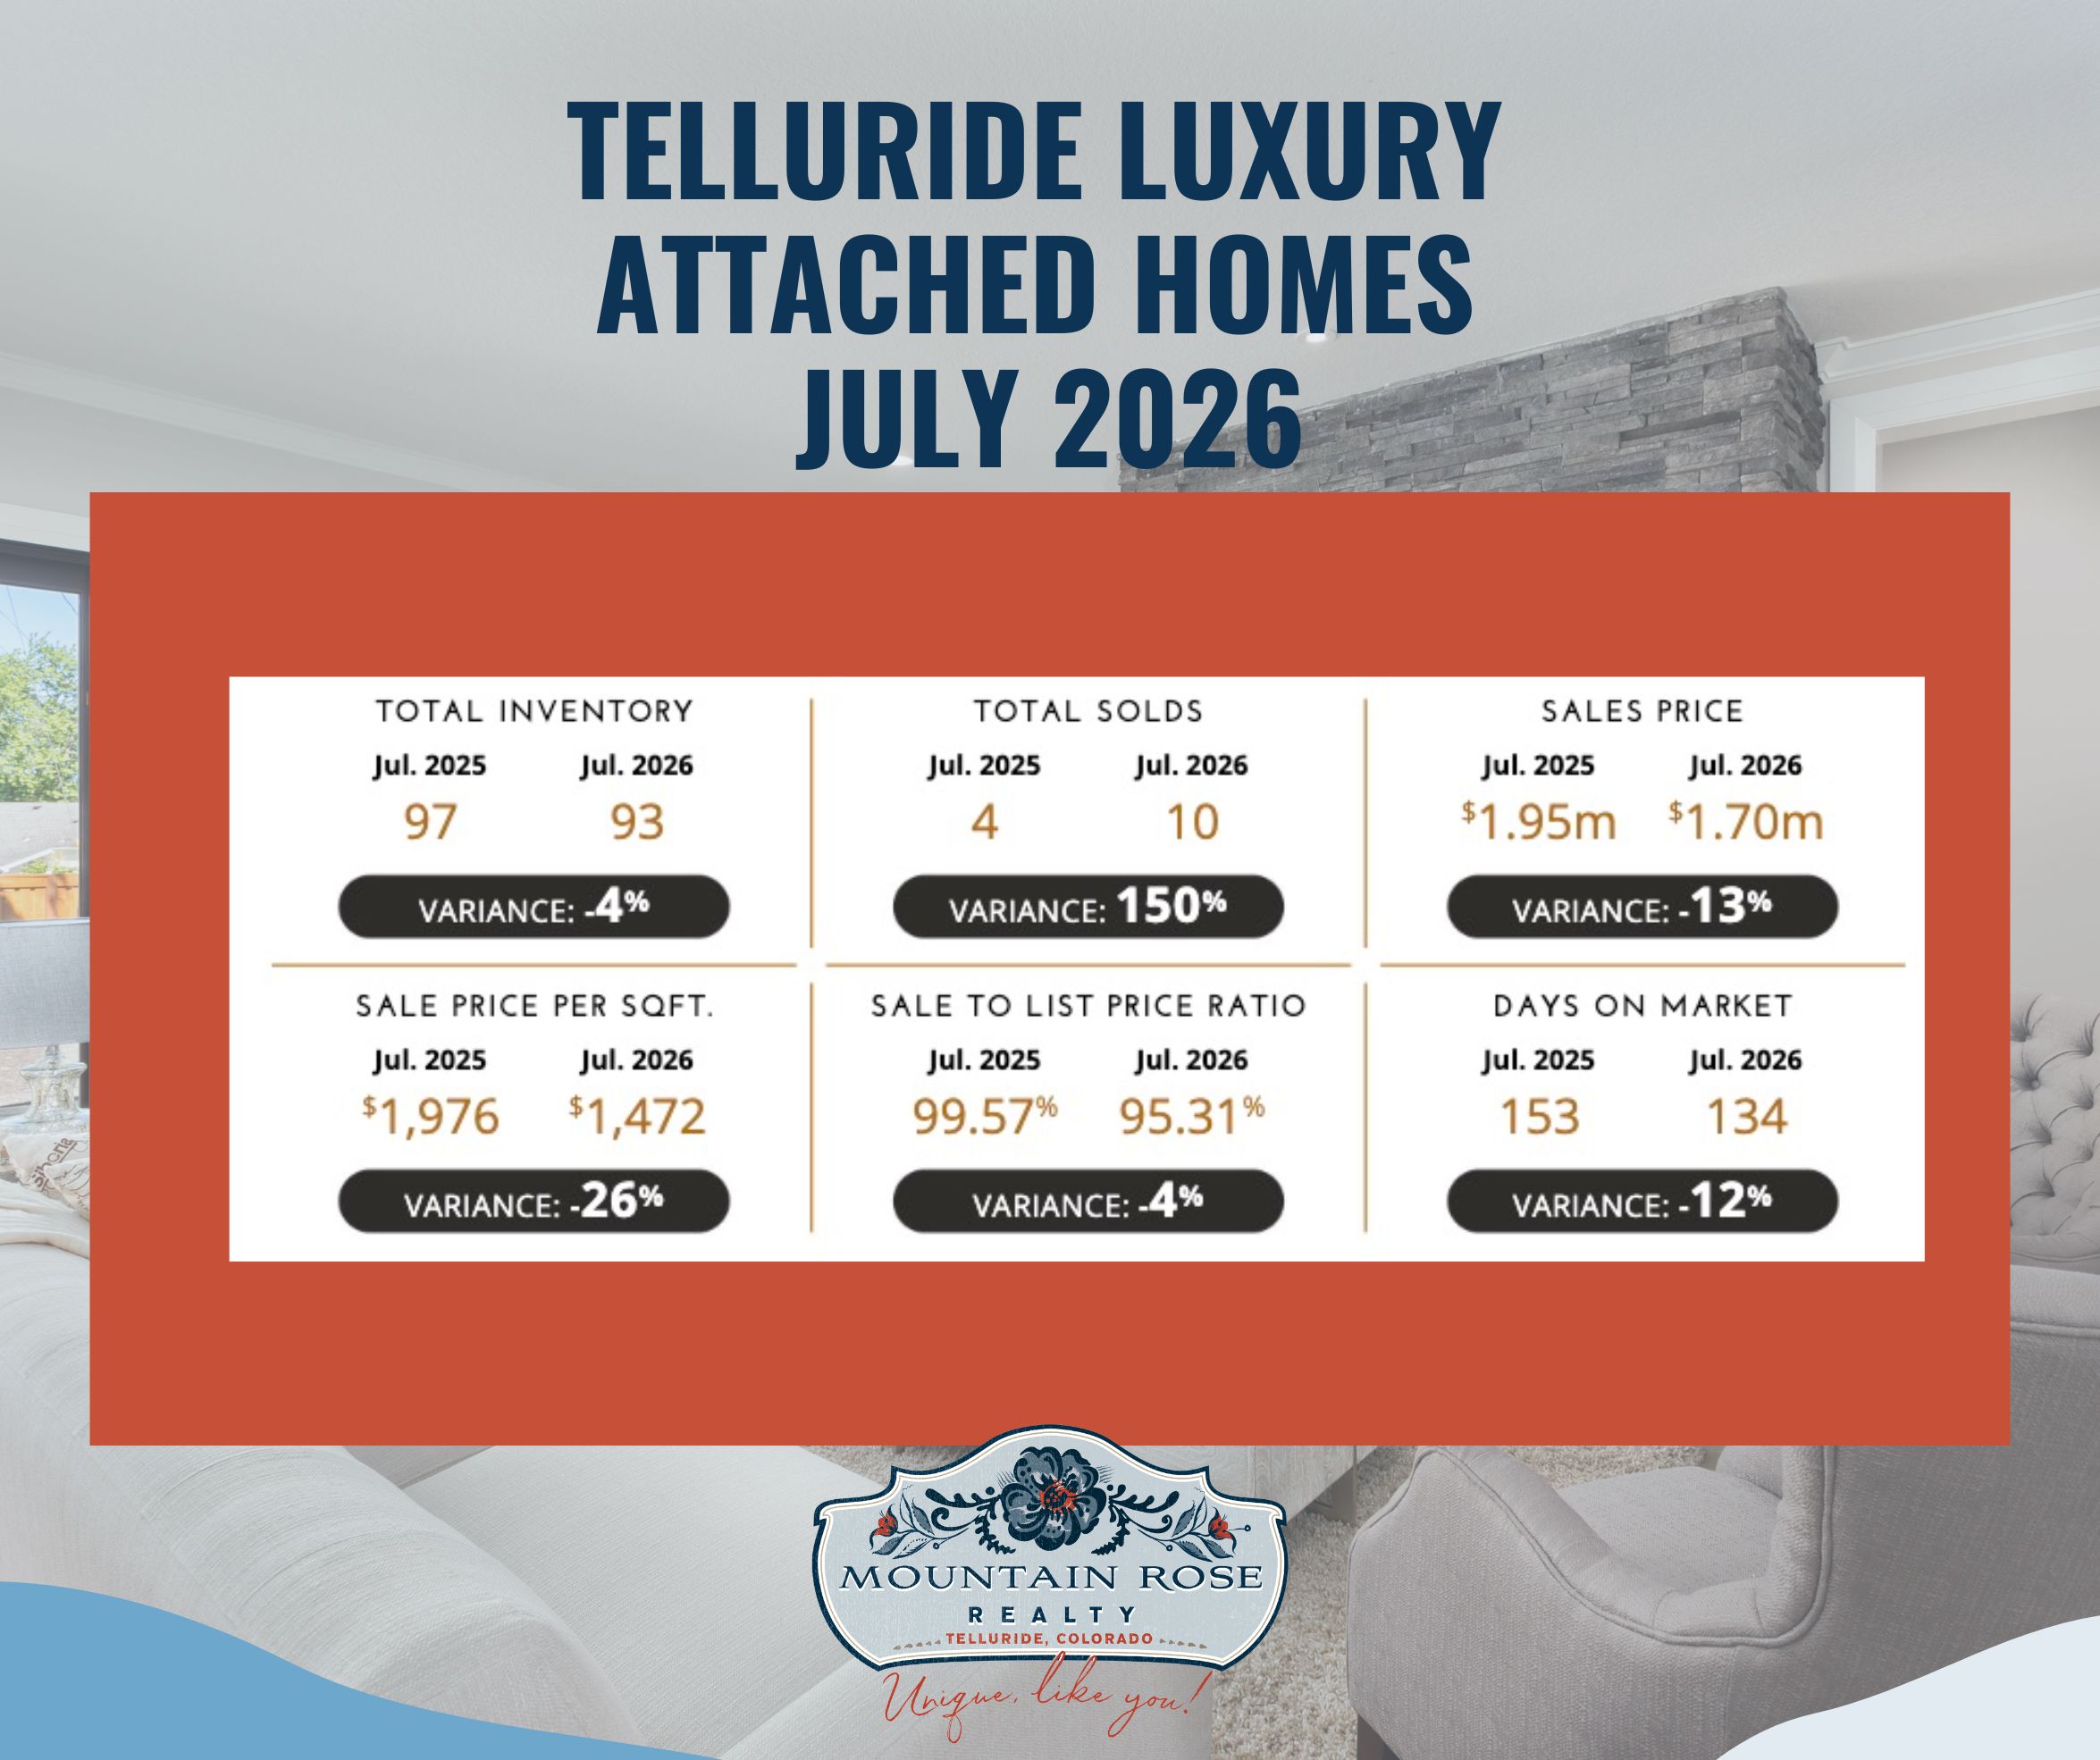
| Measure | July 2025 | July 2026 |
|---|---|---|
| Inventory | 97 | 93 |
| Sales | 4 | 10 |
| Median sales price | $1.95 million | $1.70 million |
| Reported sale price per square foot | $1,976 | $1,472 |
| Median sale-to-list price ratio | 99.57% | 95.31% |
| Median days on market | 153 | 134 |
The original summary also labels attached homes a buyer’s market, at an 11% sales ratio. Ten sales divided by 93 listed properties is approximately 10.8%. Its most active reported band was $700,000–$799,999, at a 50% ratio. That ratio compares sales with listed inventory; it is not a 50% probability that a particular home will sell, a rental return, or proof that a buyer must act immediately.
The graphic shows rounded changes of −4% in inventory, +150% in sales, −13% in median price, −26% in price per square foot and −12% in median days on market. The sale-to-list ratio fell 4.26 percentage points, from 99.57% to 95.31%; its rounded −4% variance is relative change. The 19-day decline in median marketing time applies to this attached sample and does not cancel the single-family increase.
The original summary uses sales-ratio categories of below 12% for a buyer’s market, 12% to under 21% for balanced conditions, and at least 21% for a seller’s market. They are conventions for this report. The overall 6% and 11% ratios can coexist with 25% or 50% in individual price bands because the groups and denominators differ.
The attached median sale-to-list ratio was 3.17 percentage points below the single-family ratio. That difference is worth examining with comparable sales, but it does not measure how much negotiating power any buyer has. Listing-price changes, property mix, condition and the terms of completed sales all matter.
These were the useful property-level themes in the original article. They are questions for due diligence, not evidence that any feature commands a fixed premium. Scarcity, a good view or a convenient location does not independently establish market value.
A buyer can start with the intended property type and price band, then compare recent similar sales, current alternatives, condition, ownership costs and time listed. Offer terms such as timing, furnishings and inspections should be assessed for that property and the parties’ priorities, not inferred from the area’s sales ratio.
A seller can examine the direct competitive set, recent closed comparables, current inventory, condition, unique features and the reasons a buyer might choose another home. Mountain Village alternatives may be relevant to a particular search, but should not be pooled indiscriminately with Telluride statistics. Replacement cost is another reference point, not a substitute for market evidence.
The July numbers support a segmented reading of the market: the single-family and attached samples differ, and their price bands differ again. They do not prove that values will hold, that a particular listing will sell quickly or that a future offer will succeed.
Anne-Britt Ostlund at Mountain Rose Realty can discuss how comparable properties and current listings relate to a search or listing plan. Contact Mountain Rose Realty, or follow the original channels on Facebook and Instagram.