

May 2023 archive: national home-price data. The original headline expressed optimism about early-2023 price changes. The evidence below concerns U.S. indexes, not a Telluride price series, and cannot establish that future declines are impossible or that a particular home will appreciate.
The retained graphic presents monthly percentage changes from January 2022 into early 2023. All three series show positive changes through June 2022 and negative changes in July and August. Later readings differ: FHFA shows a positive September value and zero in October, while the other two series remain negative in those months. It is more accurate to describe several months of uneven adjustment than to say all prices had stabilized by August or September.
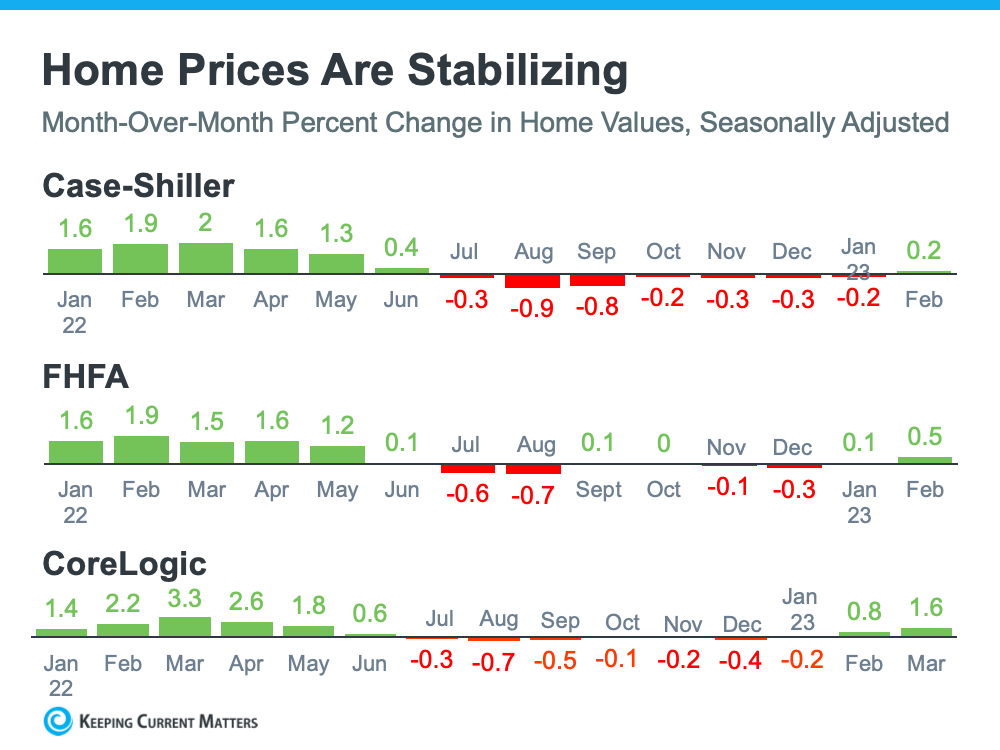
| Month | Case-Shiller | FHFA | CoreLogic |
|---|---|---|---|
| Jan 2022 | 1.6% | 1.6% | 1.4% |
| Feb 2022 | 1.9% | 1.9% | 2.2% |
| Mar 2022 | 2% | 1.5% | 3.3% |
| Apr 2022 | 1.6% | 1.6% | 2.6% |
| May 2022 | 1.3% | 1.2% | 1.8% |
| Jun 2022 | 0.4% | 0.1% | 0.6% |
| Jul 2022 | -0.3% | -0.6% | -0.3% |
| Aug 2022 | -0.9% | -0.7% | -0.7% |
| Sep 2022 | -0.8% | 0.1% | -0.5% |
| Oct 2022 | -0.2% | 0% | -0.1% |
| Nov 2022 | -0.3% | -0.1% | -0.2% |
| Dec 2022 | -0.3% | -0.3% | -0.4% |
| Jan 2023 | -0.2% | 0.1% | -0.2% |
| Feb 2023 | 0.2% | 0.5% | 0.8% |
| Mar 2023 | Not shown | Not shown | 1.6% |
These are literal values from the original graphic, which labels the panel month-over-month and seasonally adjusted. The series have different end dates and provider methodologies; the graphic is not a harmonized Telluride dataset. The blank March cells mean the chart does not display those readings, not zero change. Historical values may also be revised.
A monthly change compares consecutive months. A year-over-year change compares a month with the same month one year earlier. Monthly prices can begin rising while annual growth slows, because the annual comparison still includes earlier months. The chart’s June 2022 bars measure growth during June; they are not, by themselves, a price-level chart proving the exact date of a market peak.
FHFA’s April 2023 release reported a 0.5% seasonally adjusted increase for February, consistent with the final FHFA value shown here. Black Knight’s May 3, 2023 release reported March monthly price increases in 92% of the markets it tracked and national annual growth of 1.0%. Andy Walden linked that rebound to modestly stronger demand meeting limited inventory. That is a historical share of tracked markets, not a 92% increase in home values.
The original article also cited CoreLogic economist Selma Hepp’s interpretation that limited inventory supported the monthly rebound. Those were contemporary explanations for early-2023 national movements. One or two positive months did not guarantee continued gains.
Sellers need recent closed comparables and competing inventory for their location, property type and price range. A national index cannot set an asking price or establish how quickly a home will sell. Buyers should compare the purchase price, total ownership costs, financing and planned holding period, including a scenario in which resale value is lower. Waiting or buying should follow those facts and personal needs, not a promise that the market bottom has passed.
For a property-specific review of recent comparable sales, competing listings and your timing, contact Anne-Britt Ostlund at Mountain Rose Realty.