

September 2025 report, covering August 2025. Presented by Mountain Rose Realty and Anne-Britt Ostlund. This is a historical luxury-market snapshot, not a description of current negotiating conditions. The original report has 22 pages in its public reader; the earlier article’s 24-page description was incorrect.
The Telluride single-family pages are 18–19 and attached-home pages are 20–21. Their luxury benchmark prices are $1,500,000 and $500,000 respectively, set by the Institute for Luxury Home Marketing. These selected luxury segments should not be mistaken for every home in the region.
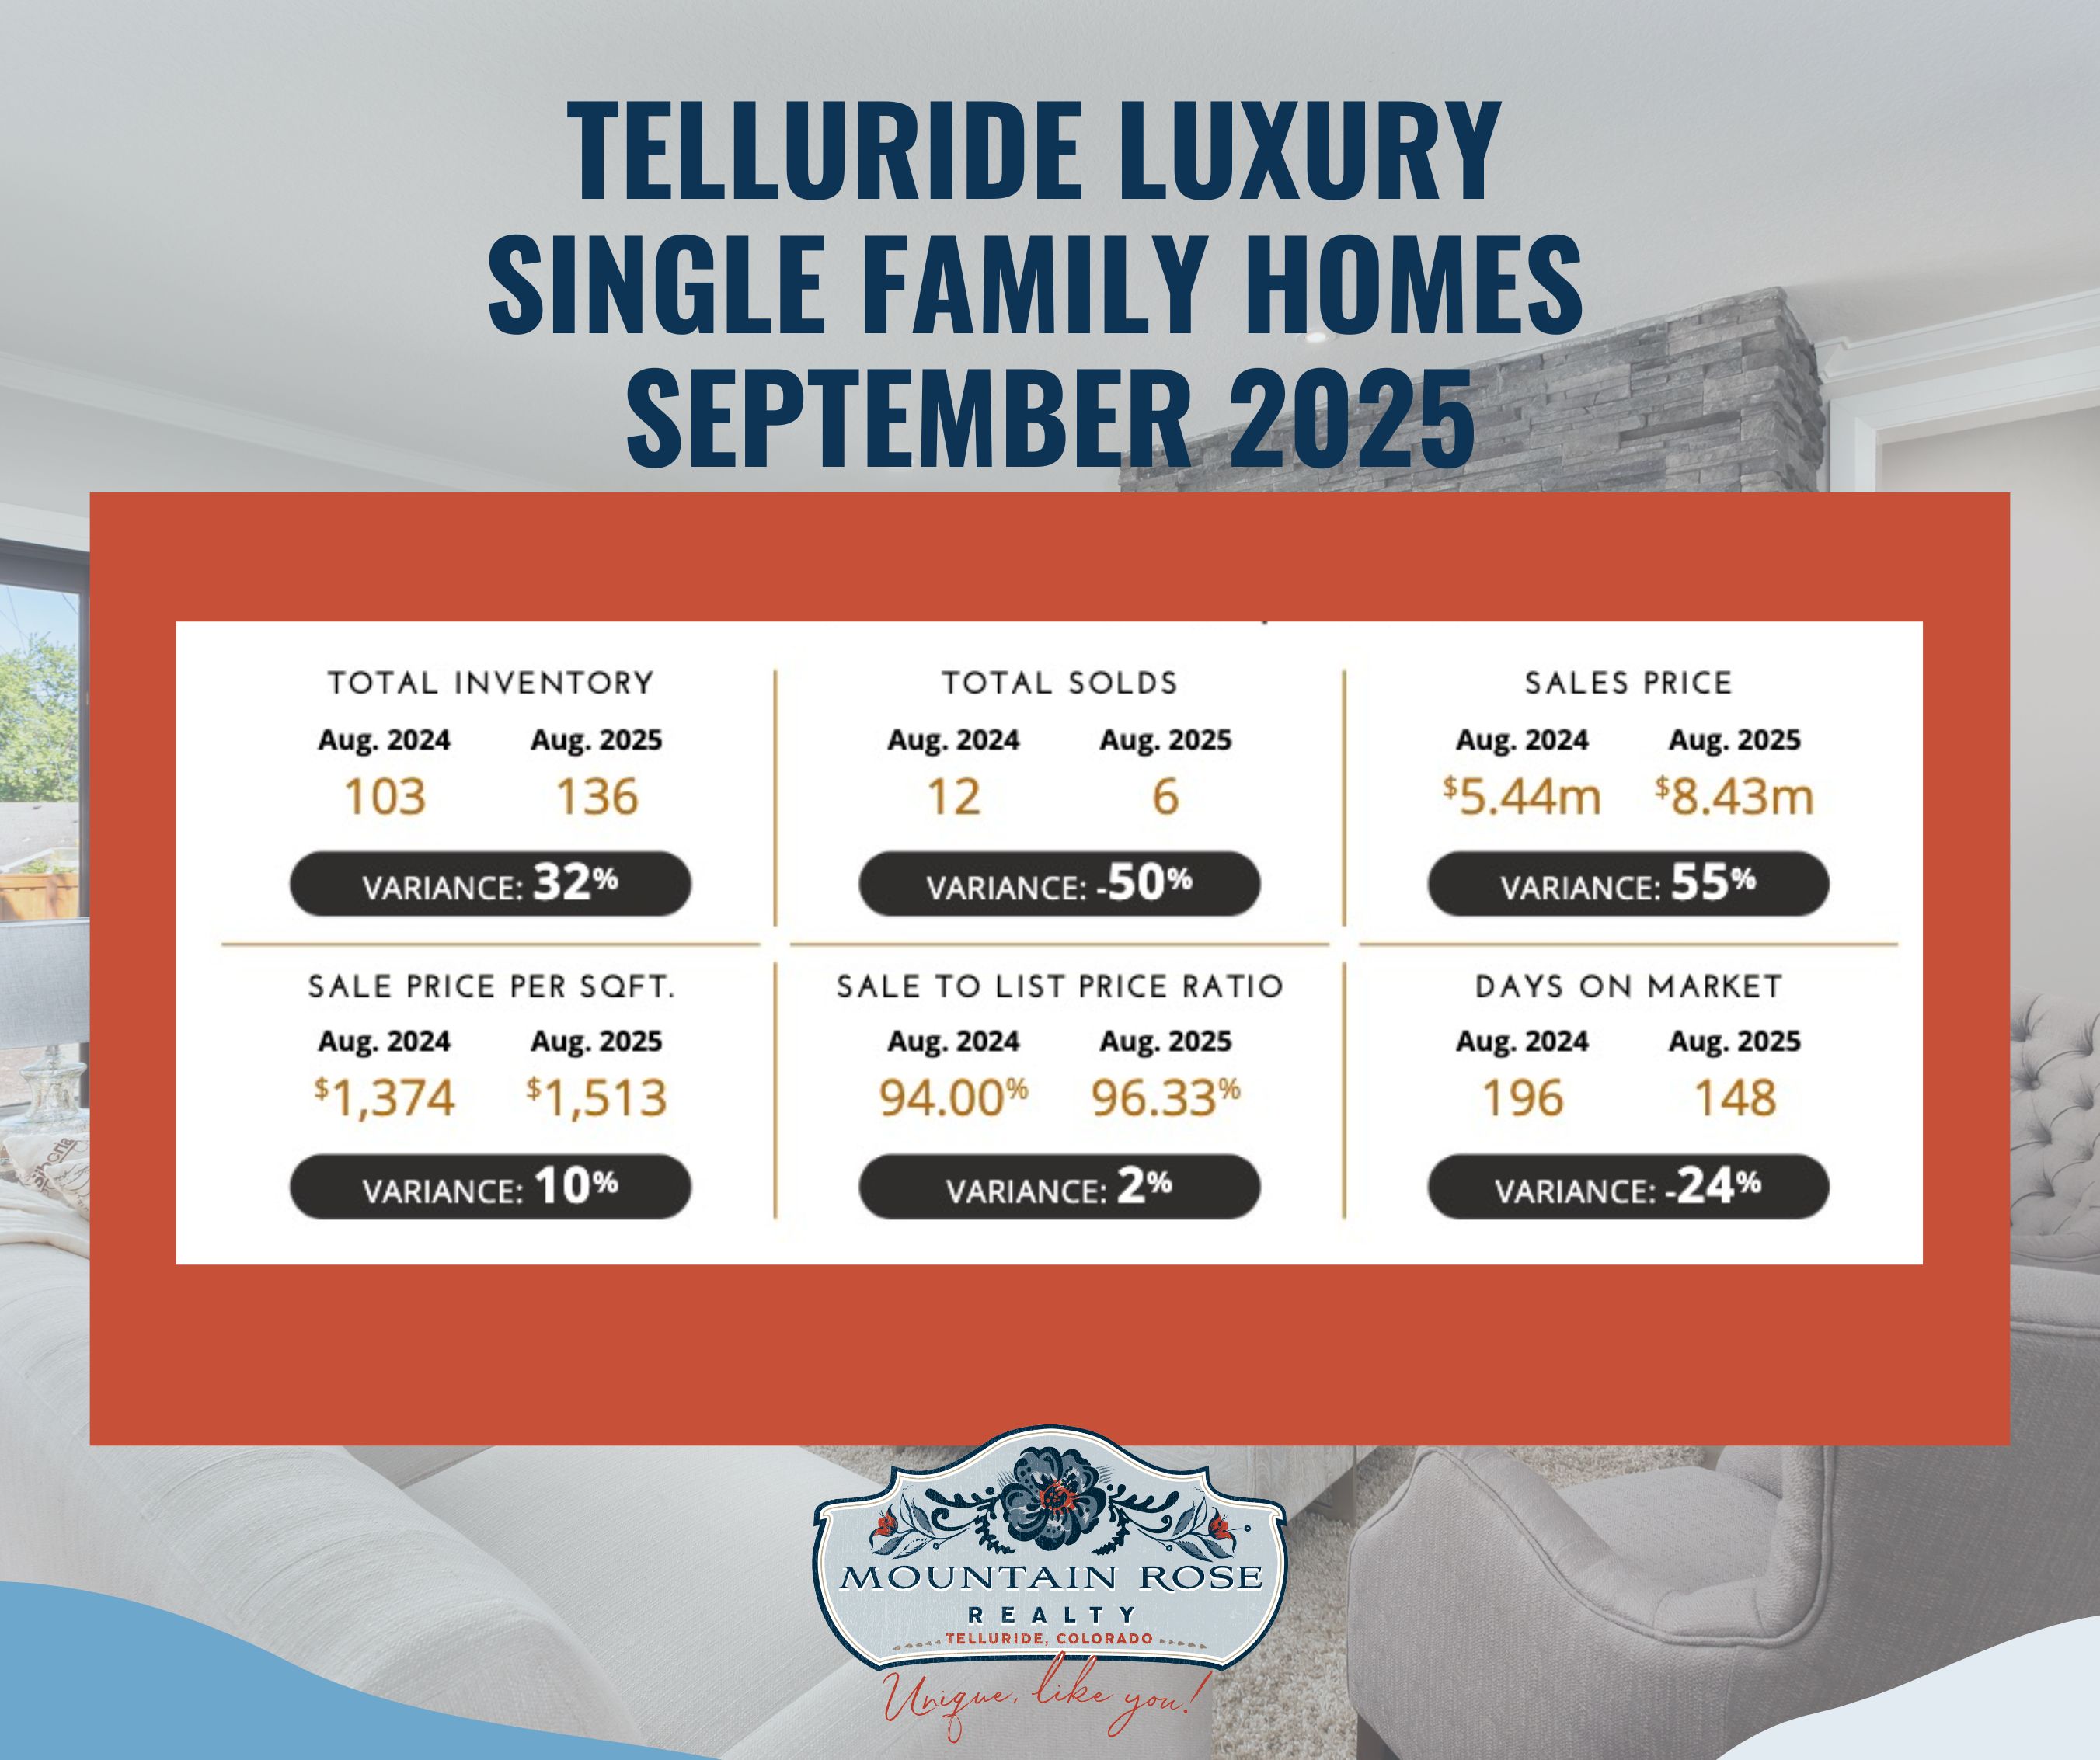
| Measure | Aug. 2024 | Aug. 2025 | Graphic variance |
|---|---|---|---|
| Total inventory | 103 | 136 | 32% |
| Total solds | 12 | 6 | −50% |
| Sales price, rounded graphic | $5.44 million | $8.43 million | 55% |
| Sale price per square foot | $1,374 | $1,513 | 10% |
| Sale-to-list price ratio | 94.00% | 96.33% | 2% |
| Days on market | 196 | 148 | −24% |
The report identifies the sales-price and days-on-market figures as medians. Its exact August 2025 median sales price is $8,425,000, and the median marketing time is 148 days. Only six sales contributed to that month’s segment. A higher median with fewer sales can reflect which properties sold; it does not mean every single-family home appreciated 55%.
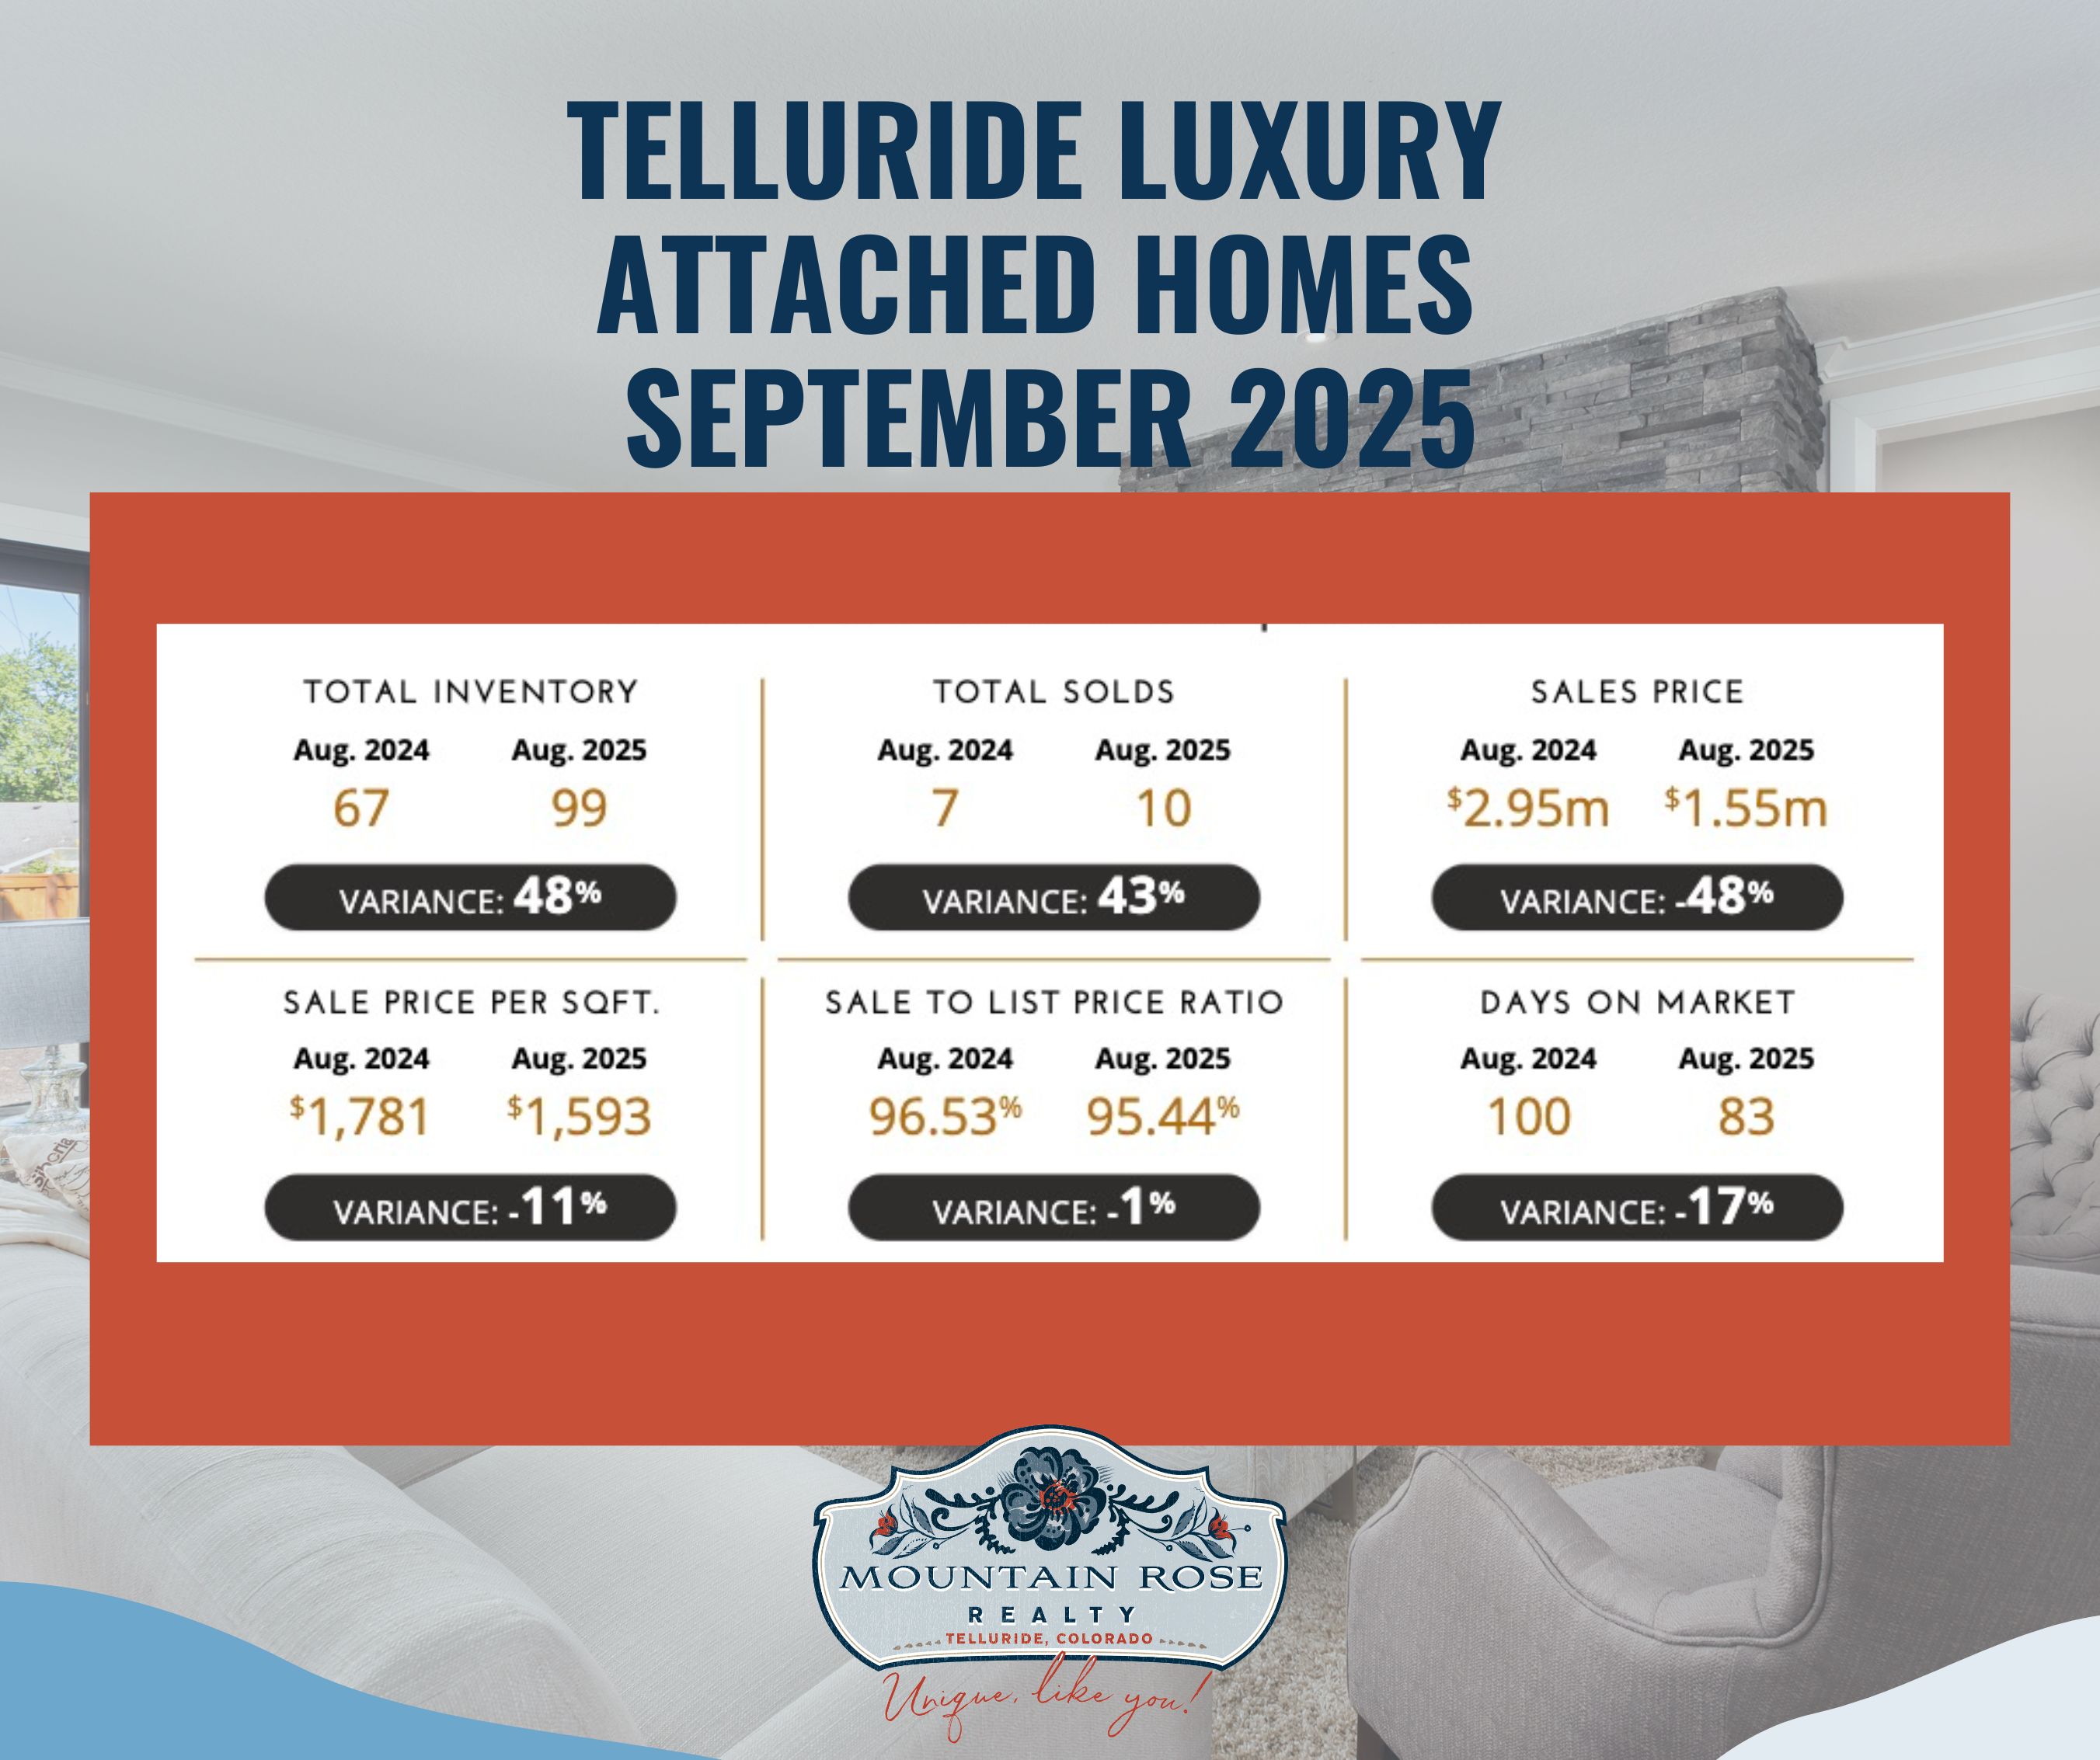
| Measure | Aug. 2024 | Aug. 2025 | Graphic variance |
|---|---|---|---|
| Total inventory | 67 | 99 | 48% |
| Total solds | 7 | 10 | 43% |
| Sales price, rounded graphic | $2.95 million | $1.55 million | −48% |
| Sale price per square foot | $1,781 | $1,593 | −11% |
| Sale-to-list price ratio | 96.53% | 95.44% | −1% |
| Days on market | 100 | 83 | −17% |
The exact August 2025 attached median sales price is $1,545,000. The 83 days on market is a median, not the average stated in an earlier FAQ. Ten attached sales were recorded. The lower median does not establish a 48% loss in value for a particular condo or townhome.
The report displays a 4% single-family sales ratio, using six sales and 136 inventory entries, and a 10% attached ratio, using ten sales and 99 inventory entries. It labels ratios below 12% as a buyer’s market, 12% to under 21% as balanced, and 21% or more as a seller’s market. Those are this report’s classifications, not a prediction of a buyer’s discount or a particular listing’s chance of selling.
The most active single-family price band was $8,000,000–$8,999,999, with two sales against eleven inventory entries, displayed as 18%. For attached homes, the $900,000–$999,999 band had two sales and two inventory entries, displayed as 100%. Two observations are not enough to conclude that the entire sub-$1 million market was “red hot” or that it offered the best investment entry point.
Sale-to-list price ratios are a separate measure: 96.33% and 95.44% describe the report’s median sale prices relative to list prices. The single-family change from 94.00% to 96.33% is 2.33 percentage points; the attached change is −1.09 percentage points. The graphic’s 2% and −1% variance labels are retained literally above and should not be read as the same calculation.
The report notes that its data include active and sold properties but exclude pending properties; its square-foot tables omit entries without disclosed square footage. A small set of closings can move a monthly median substantially. Before buying or selling, compare current, relevant properties by location, condition, property type, price and use constraints. Ask how the specific home compares with available alternatives rather than treating a segment label as guaranteed negotiating power.
For a property-specific review, contact Anne-Britt Ostlund at Mountain Rose Realty. Original social links: Facebook and Instagram.