

This December 18, 2024 article explored national seasonal homebuying patterns using graphics attributed to the National Association of Realtors. The graphics remain below as historical context. A Telluride winter purchase needs its own current local comparison.
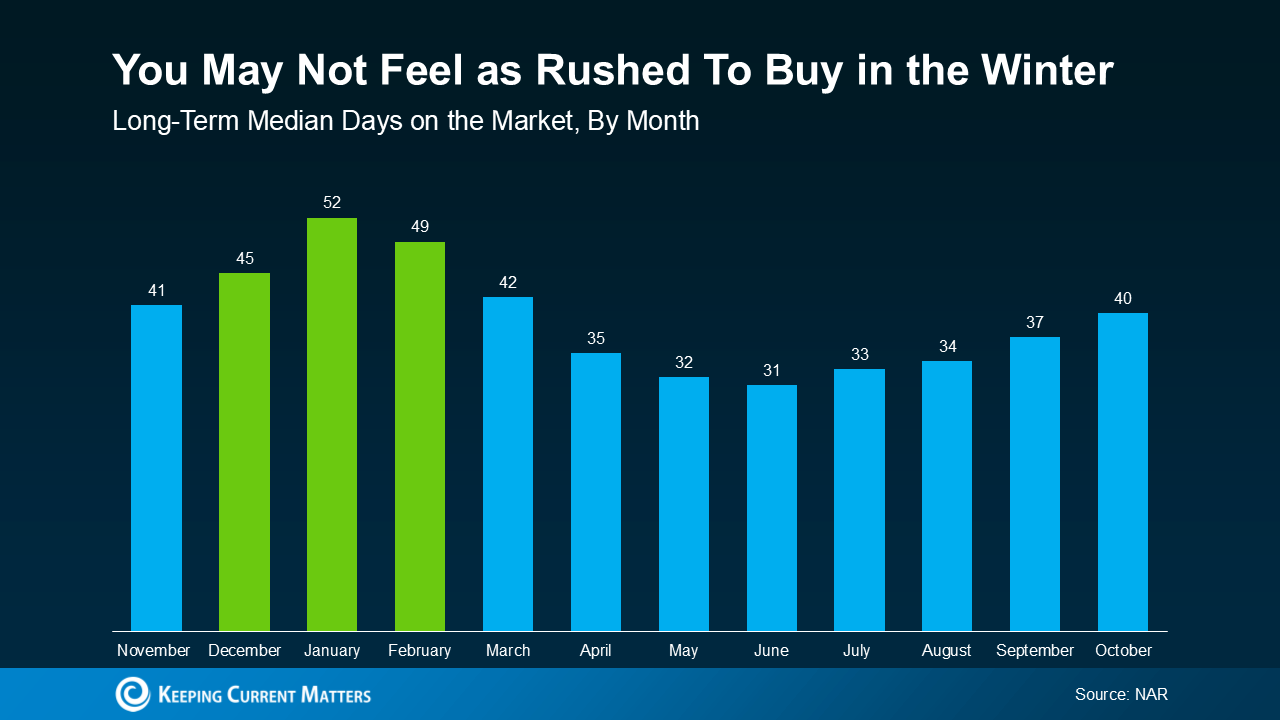
The first chart is labeled long-term median days on market by month. It shows November 41, December 45, January 52, February 49, March 42, April 35, May 32, June 31, July 33, August 34, September 37 and October 40. The graphic does not print the years used for this long-term calculation. It shows a seasonal pattern in the cited national series, not how long a specific Telluride listing will remain available.
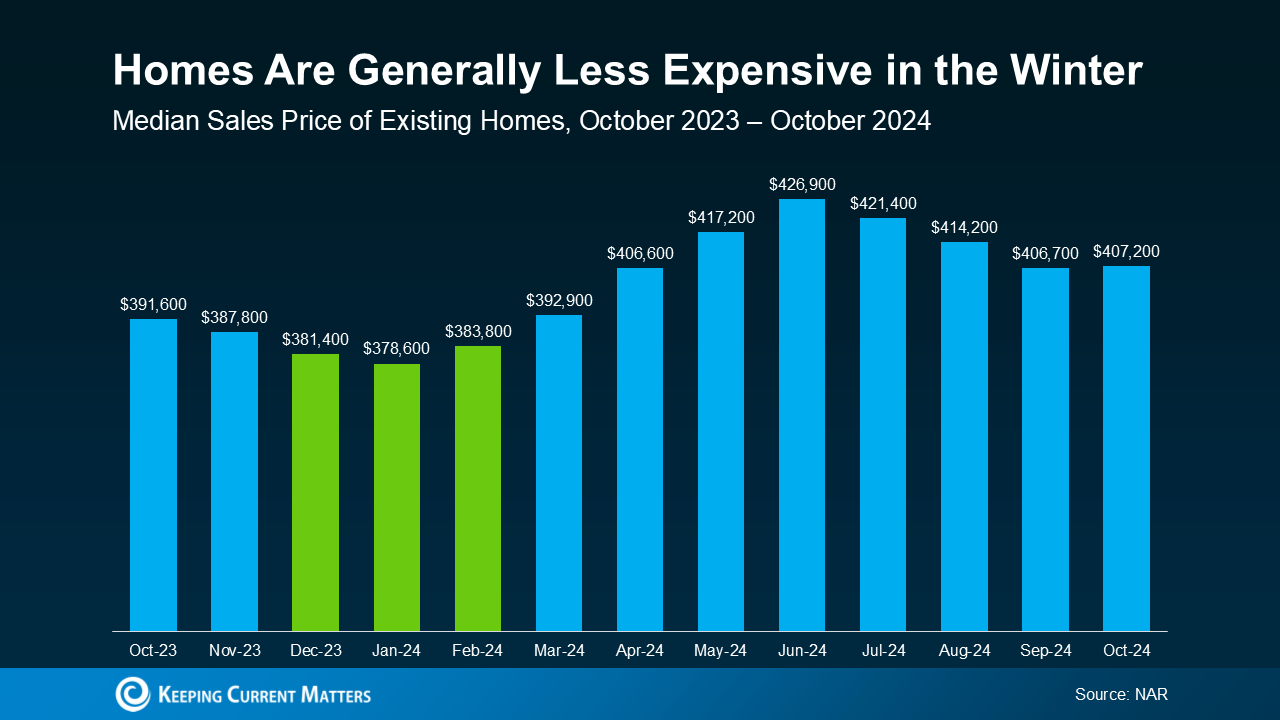
The second chart covers national median existing-home sale prices from October 2023 through October 2024. Its January 2024 figure is $378,600 and its June 2024 figure is $426,900. These are medians for different groups of completed sales. They do not show that the same home became cheaper in winter, nor do they establish a buyer’s negotiated discount.
The original article discussed the possibility of more time to consider a purchase and sellers being willing to negotiate. Those possibilities depend on the actual listing, competing buyers, seller priorities and contract terms. A historical seasonal chart cannot establish a $20,000 saving on a $400,000 property or predict a later season.
Compare current local listings and recent sales by property type, location, condition and price. Review winter access, snow removal, inspection arrangements, ownership costs and the financing timeline. In a mountain resort market, national seasonal averages may not describe the properties a buyer is considering.
Anne-Britt Ostlund at Mountain Rose Realty can help compare those options and discuss an offer’s terms. Choose timing around the household’s budget and plans rather than a promised seasonal advantage.