

January 2024 article archive, using historical U.S. household data. Homeownership can build equity, but the original comparison does not show that buying a home automatically creates a particular amount of wealth. The figures are not a Telluride return forecast.
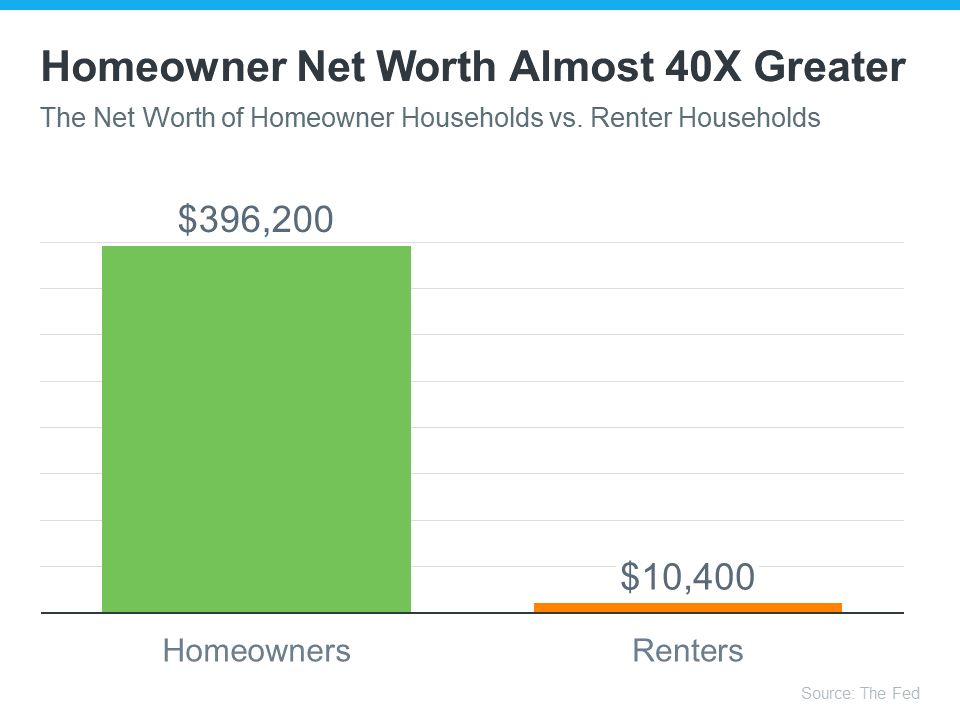
The Federal Reserve’s October 2023 report on the 2022 Survey of Consumer Finances, table 2, reports median net worth of $396,200 for owner families and $10,400 for the “renter or other” group, in 2022 dollars. The ratio is about 38.1 to one. The graphic rounds that relationship to “almost 40X” and shortens the second category to renters. The earlier prose and FAQ incorrectly called these averages.
| 2022 SCF housing status | Median net worth |
|---|---|
| Owner | $396,200 |
| Renter or other | $10,400 |
Net worth is assets minus liabilities, not income, a home’s market value or cash available to spend. The comparison describes groups whose age, income, prior wealth and circumstances differ. It does not isolate homeownership’s causal effect, and it is not evidence that an individual can multiply their wealth 38 times simply by purchasing.
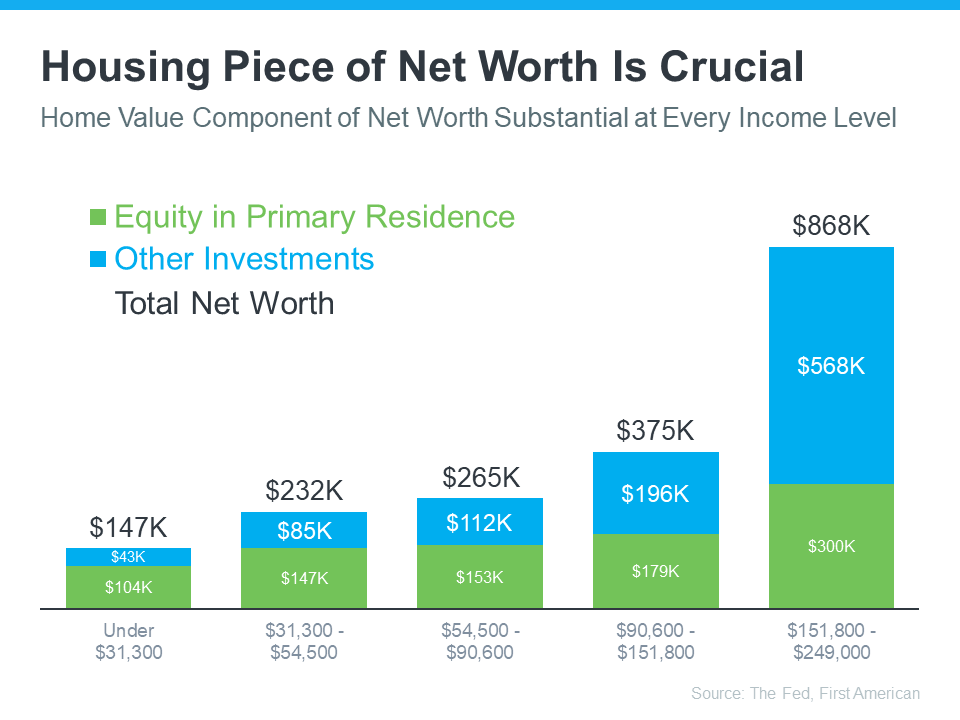
| Income band printed in graphic | Primary-residence equity | Other investments | Total net worth |
|---|---|---|---|
| Under $31,300 | $104,000 | $43,000 | $147,000 |
| $31,300–$54,500 | $147,000 | $85,000 | $232,000 |
| $54,500–$90,600 | $153,000 | $112,000 | $265,000 |
| $90,600–$151,800 | $179,000 | $196,000 | $375,000 |
| $151,800–$249,000 | $300,000 | $568,000 | $868,000 |
The table transcribes the retained illustration’s rounded dollar labels. That graphic credits the Federal Reserve and First American but does not print a survey year or identify the statistical measure for each component. It should not be presented as a verified breakdown of the first chart’s 2022 medians. The two source years and calculation methods have not been reconciled.
The illustration itself also contradicts the claim that home equity is the largest component at every income level: in its top two displayed bands, the blue “other investments” component is larger than primary-residence equity. First American’s discussion of SCF wealth composition describes how housing’s share differs across income groups. A chart of group components is not a recommendation to concentrate all savings in one property.
Equity is the property’s value minus debt secured by it. The principal portion of a mortgage payment reduces the loan balance; interest, taxes, insurance and maintenance do not themselves pay down principal. An increase in value can add equity, while a decline can reduce it. Selling expenses and remaining debt reduce the proceeds available at sale. Borrowing against equity creates a repayment obligation rather than free income.
Rent pays for housing and flexibility rather than ownership of that home. Renters may save and invest elsewhere, and owners also face costs and risks. The original claim that renters could never build comparable wealth was too broad. The original Ksenia Potapov and Nicole Bachaud comments emphasized equity and long-term stability; those ideas do not establish that ownership is best for every household.
Compare an actual purchase with a realistic rental option over your intended time horizon. Include upfront costs, the full monthly housing payment, maintenance, liquidity needs, possible moves and different resale outcomes. The article’s early-2024 statements about falling mortgage rates and increasing inventory are historical context, not today’s conditions. For a property comparison, contact Anne-Britt Ostlund at Mountain Rose Realty; obtain financing and tax guidance appropriate to your situation before relying on a projected financial result.