
This May 15, 2023 infographic illustrates how different fixed interest-rate assumptions affect a modeled monthly principal-and-interest payment. The rates are examples from an archived article, not current offers.
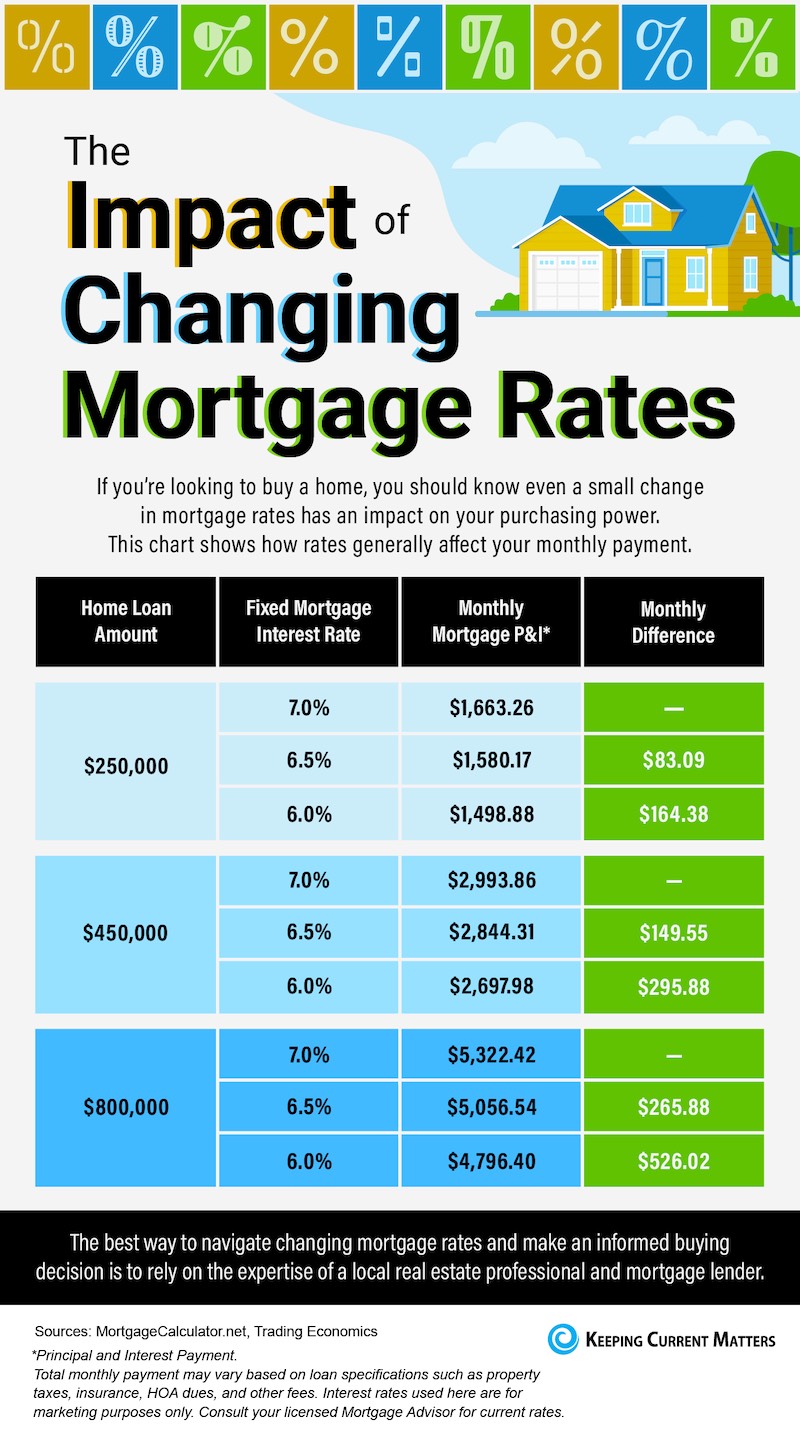
For a $250,000 loan, the graphic shows $1,663.26 at 7%, $1,580.17 at 6.5% and $1,498.88 at 6%. For $450,000, it shows $2,993.86, $2,844.31 and $2,697.98. For $800,000, it shows $5,322.42, $5,056.54 and $4,796.40 at the same respective rates.
The difference from 7% to 6.5% is half a percentage point. The graphic’s payment differences are relative to its 7% example for each loan amount. It attributes the illustration to MortgageCalculator.net and Trading Economics and labels the amounts as principal and interest. A loan term is not printed in the graphic, so it should not be treated as a complete loan quotation.
Taxes, insurance, mortgage insurance, HOA charges and other expenses can add to the housing payment. Eligibility, fees, points and rate-lock terms also affect an actual loan. Ask a lender for scenarios using the same loan amount, term, down payment and loan type so the comparison is meaningful.
A lender determines qualification and provides written loan terms. Anne-Britt Ostlund at Mountain Rose Realty can help compare properties and transaction terms. Neither the infographic nor a brokerage conversation guarantees a rate, approval, best deal or a reason to rush a purchase.