

October 2023 archive. Seasonal patterns can help explain why a monthly growth rate changes during the year. They do not guarantee that home prices rise every month or establish what will happen to an individual Telluride property.
For example, an increase slowing from 0.8% to 0.2% is still an increase. A change of −0.2% is a decline. A headline about slower growth does not, by itself, say prices fell.
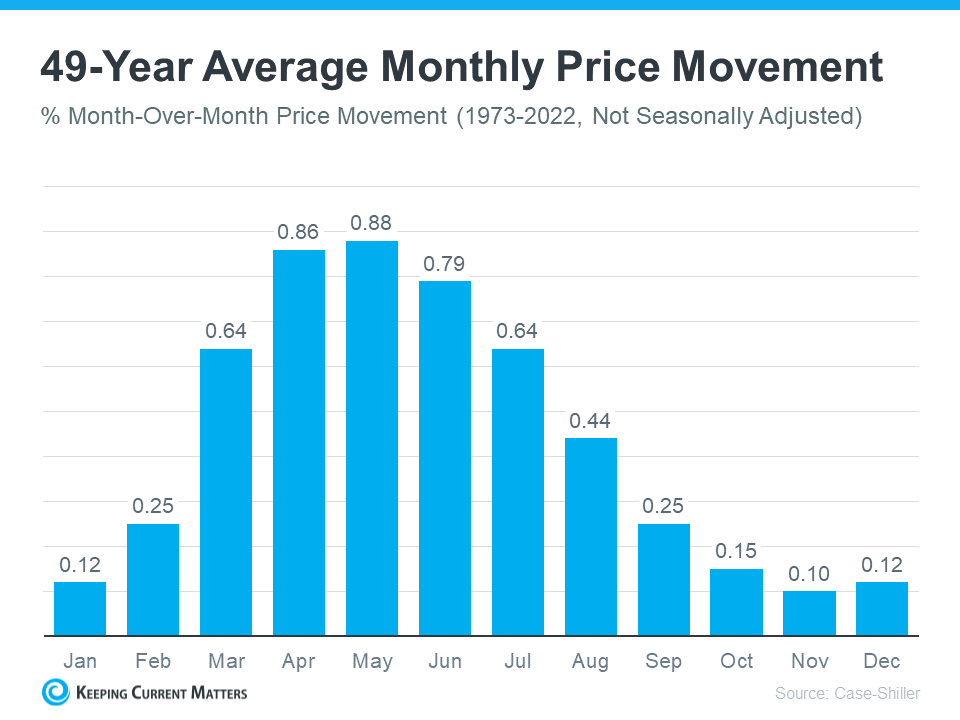
| Month | Average monthly movement shown |
|---|---|
| January | 0.12% |
| February | 0.25% |
| March | 0.64% |
| April | 0.86% |
| May | 0.88% |
| June | 0.79% |
| July | 0.64% |
| August | 0.44% |
| September | 0.25% |
| October | 0.15% |
| November | 0.10% |
| December | 0.12% |
The graphic attributes the series to Case-Shiller and labels it not seasonally adjusted. Its title says “49-Year Average Monthly Price Movement,” while its subtitle gives “1973–2022.” Those inclusive calendar-year endpoints span 50 years. The underlying series, exact date window and calculation were not supplied with this article, so that labeling difference remains unresolved. The values above are a literal transcription of the retained illustration, not a newly reproduced research series.
In this illustration, the highest average is May’s 0.88%, with smaller positive averages later in the year. An average combines observations and can hide negative months or years. It does not mean every home, region or month followed the curve. A not-seasonally-adjusted monthly series also should not be casually compared with a seasonally adjusted figure from another report.
The original article cited then-CoreLogic economist Selma Hepp’s view that slowing monthly gains could reflect a return toward seasonal patterns after the unusual pandemic period. That was a contemporary interpretation, not a finding that prices could not decline. For any particular release, check its reporting month, geography, adjustment method and whether it compares with the previous month or the same month a year earlier.
A Telluride sale or purchase needs comparable transactions and competing inventory for the relevant neighborhood, property type and price range. A national historical seasonal curve cannot set the listing date or price. Consider the seller’s readiness, property condition, financing and intended holding period alongside the local market. A seasonal pattern is context, not a promised outcome.
For a review of comparable sales, competing listings and the practical details of a Telluride or Mountain Village property, contact Anne-Britt Ostlund at Mountain Rose Realty.