

May 2023 market archive. The original headline expressed a view that the worst price declines had passed. The retained graphic shows a short historical series; it cannot establish a permanent price floor or rule out later declines.
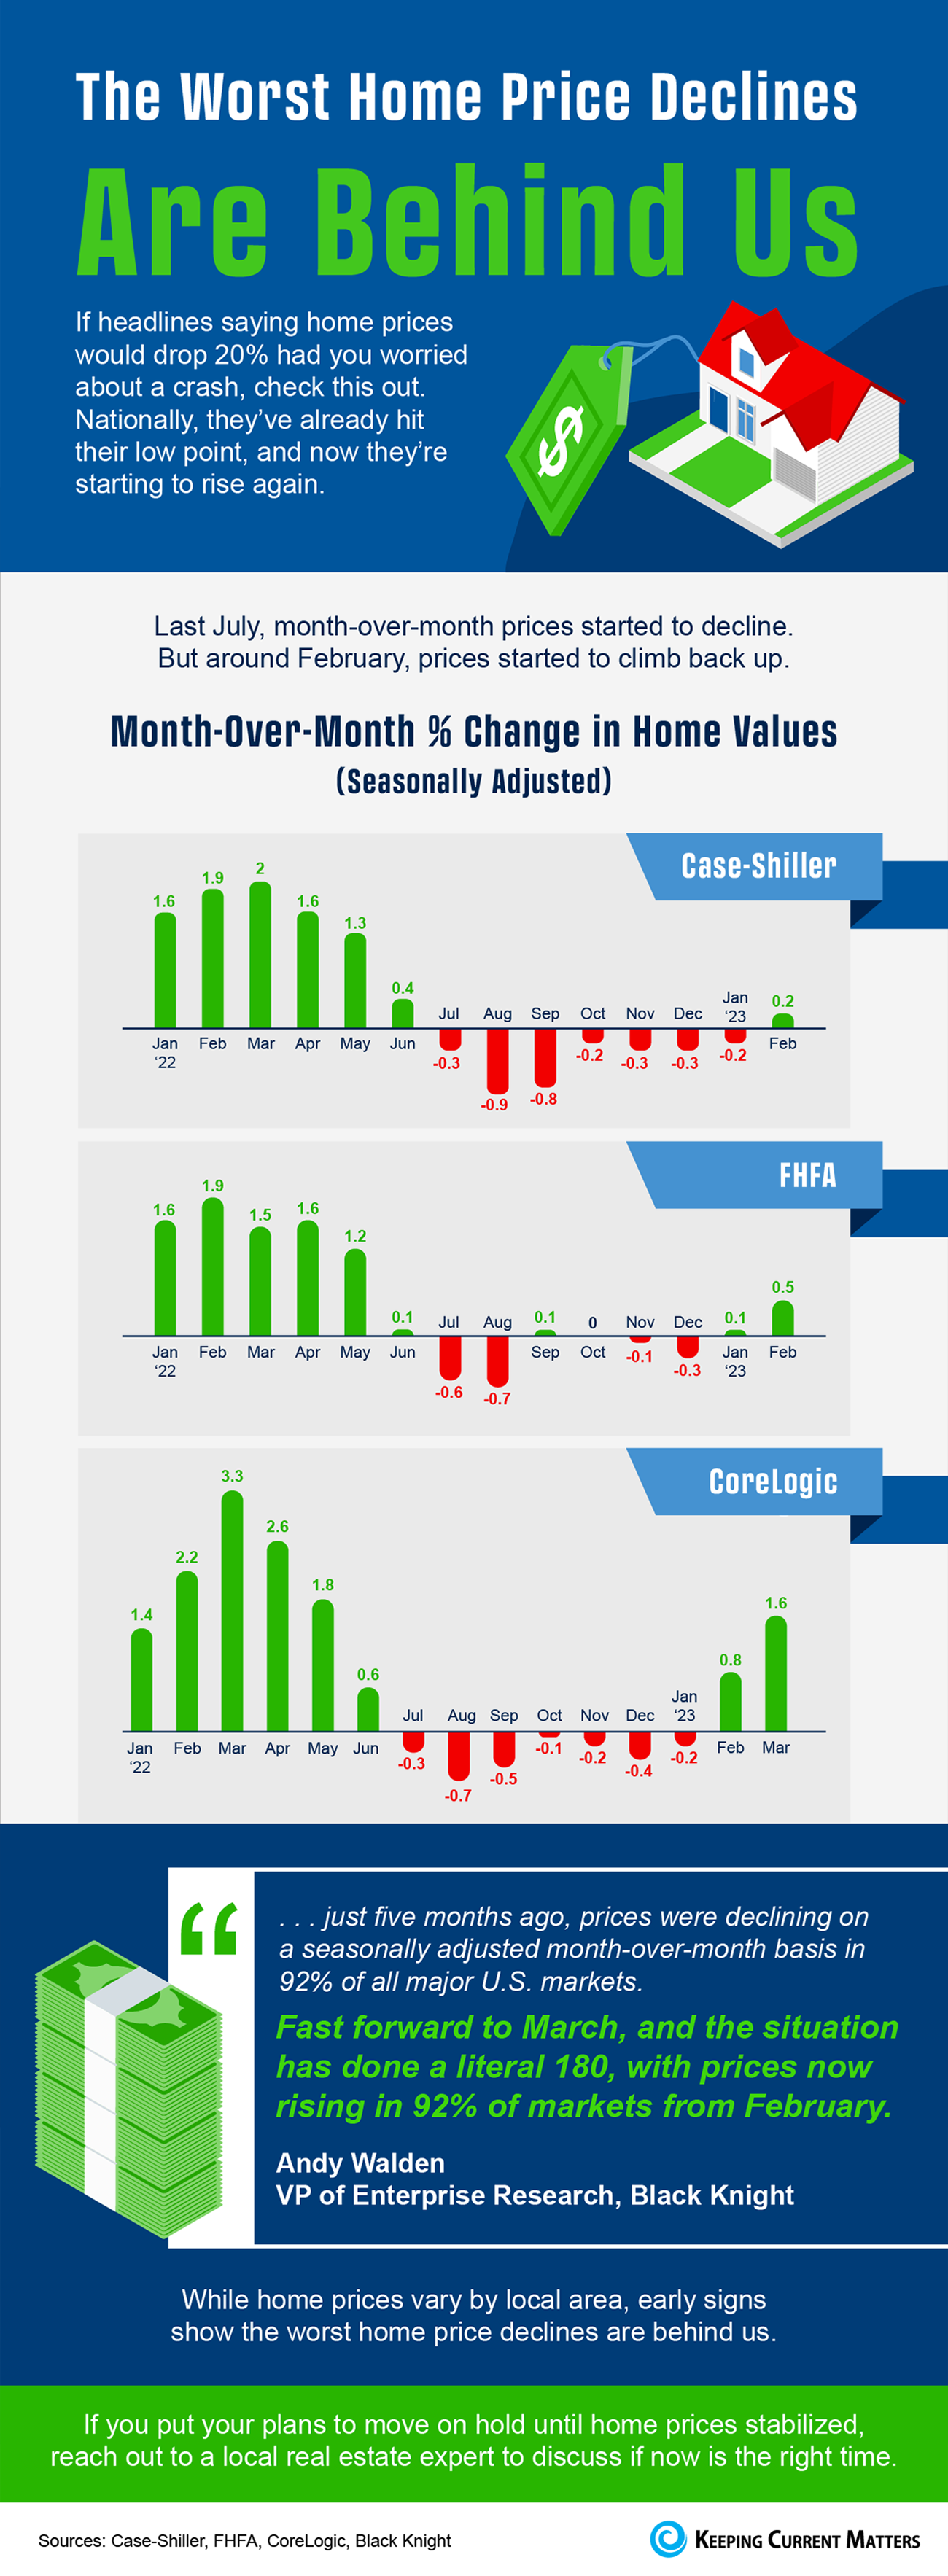
The graphic labels its measures as seasonally adjusted month-over-month changes in home values. Case-Shiller and FHFA run from January 2022 through February 2023; CoreLogic extends through March 2023. For February 2023, the displayed changes are +0.2% for Case-Shiller, +0.5% for FHFA and +0.8% for CoreLogic. The CoreLogic March value is +1.6%.
The series do not turn positive in precisely the same month: for example, the FHFA row also shows +0.1% in January 2023, while the other two rows are negative that month. A monthly change is different from a year-over-year change, an index level or the price movement of one home.
Positive observations after a decline do not establish that all markets reached a bottom, that every property increased in value or that prices cannot fall again. These broad measures are not a Telluride property valuation or a reason to disregard financing and ownership risk.
For a current decision, compare relevant local closed sales, active alternatives, condition, financing and total costs. Mountain Rose Realty can help assemble that comparison. This archive does not tell a reader that buying now is optimal or that an investment is protected from loss.