

October 1, 2023 archive, with graphics through the second quarter of 2023. Long-term price history can provide context for homeownership. It does not make a purchase risk-free or establish the return an individual owner will earn.
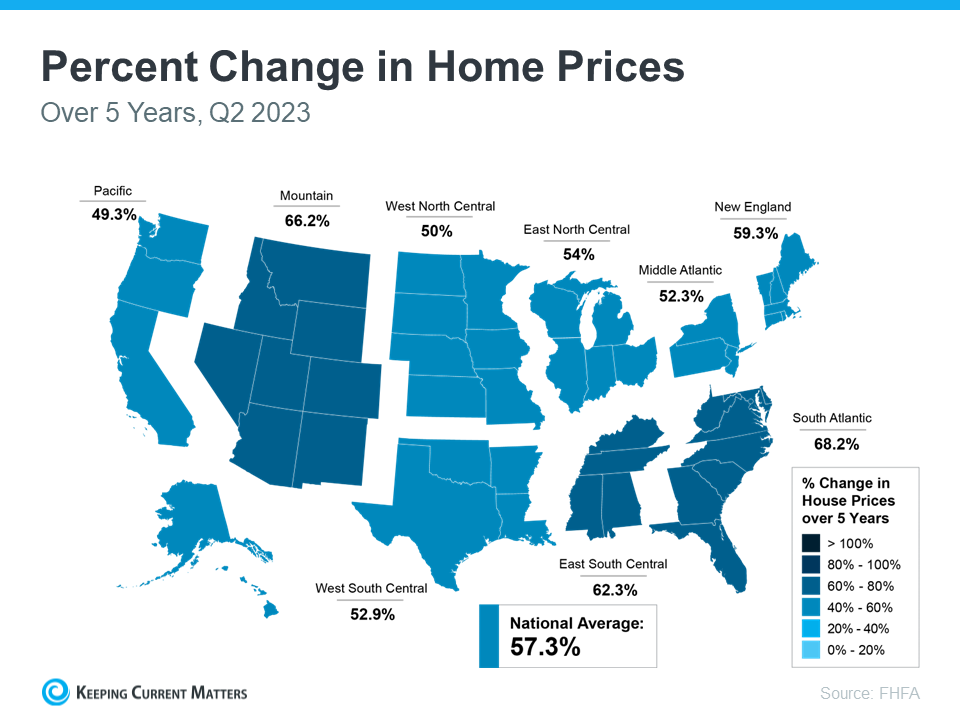
| Region | Five-year change through Q2 2023 |
|---|---|
| Pacific | 49.3% |
| Mountain | 66.2% |
| West North Central | 50% |
| East North Central | 54% |
| New England | 59.3% |
| Middle Atlantic | 52.3% |
| South Atlantic | 68.2% |
| East South Central | 62.3% |
| West South Central | 52.9% |
| National average | 57.3% |
The graphic attributes these figures to FHFA and identifies the national change as 57.3%. The Mountain division’s 66.2% is a regional figure, not a Telluride, San Miguel County or individual-property result. The mapped regions cover different markets and should not be treated as comparable neighborhoods.
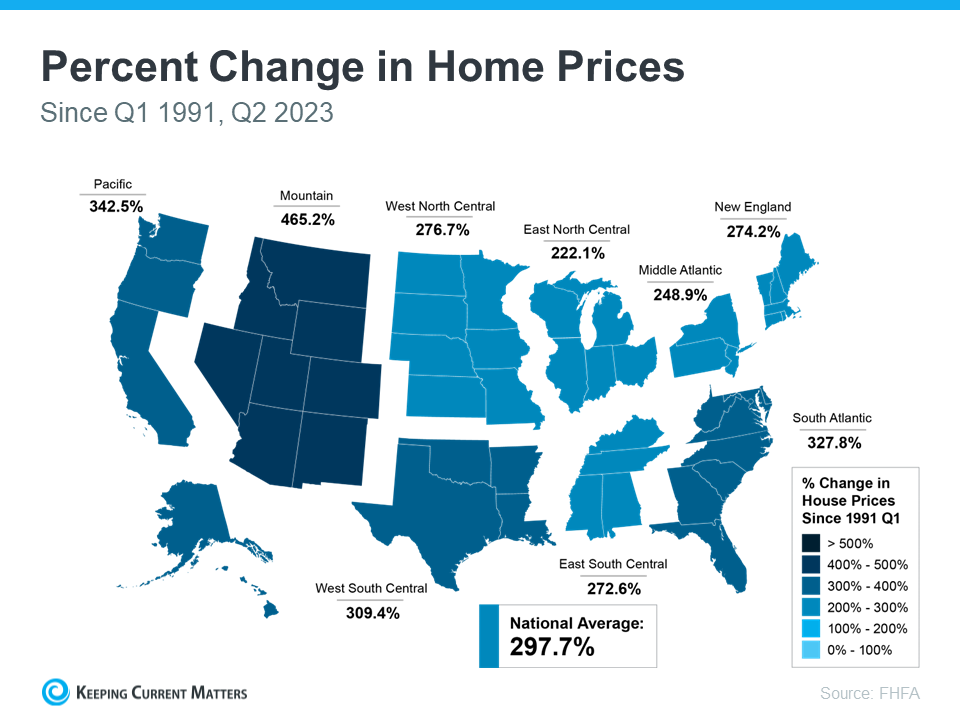
| Region | Change from Q1 1991 to Q2 2023 |
|---|---|
| Pacific | 342.5% |
| Mountain | 465.2% |
| West North Central | 276.7% |
| East North Central | 222.1% |
| New England | 274.2% |
| Middle Atlantic | 248.9% |
| South Atlantic | 327.8% |
| East South Central | 272.6% |
| West South Central | 309.4% |
| National average | 297.7% |
This second graphic spans Q1 1991 through Q2 2023, approximately 32 years, rather than an exact 30-year window. Its national figure is a 297.7% increase. Adding the starting 100% gives an ending level equal to 397.7% of the initial level, or 3.977 times it. The original article’s description of an increase of that size as “almost triple” understated the ending-value multiple.
The charts’ FHFA attribution is retained. FHFA’s Q2 2023 report is the primary release for that period. The supplied illustrations do not identify their precise index variant or reproduce all calculation steps, so the transcribed long-window values are not presented as a newly calculated series. A broad index is not the same as an appraisal, a median sale price or the profit from owning a specific home.
Fannie Mae’s Q4 2022 National Housing Survey reported that 76% of homeowners viewed buying a home as a safe investment; the general-population figure was 70%. These are dated survey responses about perceived safety, not investment returns or guarantees.
The displayed price changes do not deduct inflation, mortgage interest, taxes, insurance, maintenance, HOA costs or transaction expenses. Financing changes both cash flow and risk. An owner’s proceeds also depend on the actual purchase and sale prices, remaining loan balance and selling costs.
A longer holding period may change how a household evaluates short-term movements, but it cannot guarantee appreciation or remove the risk of needing to sell at an unfavorable time. For Telluride or Mountain Village, compare similar properties and test the ongoing costs against your plans, reserves and ability to handle a decline.
For comparable sales, competing listings and property-specific questions in Telluride or Mountain Village, contact Anne-Britt Ostlund at Mountain Rose Realty.