

June 30, 2023 archive. The original discussion asked buyers to consider a longer holding period amid concerns about rates, inflation and recession. The retained graphics provide historical price context. They do not show that every homeowner gained, avoided regret or earned the same return.
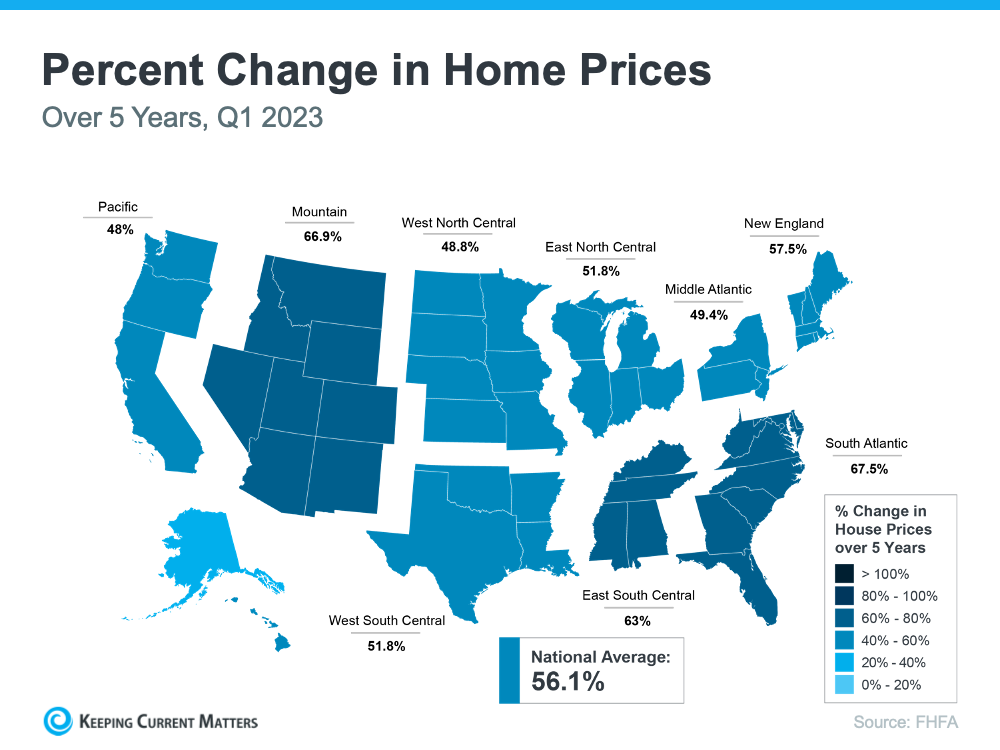
| Region | Five-year change |
|---|---|
| Pacific | 48% |
| Mountain | 66.9% |
| West North Central | 48.8% |
| East North Central | 51.8% |
| New England | 57.5% |
| Middle Atlantic | 49.4% |
| South Atlantic | 67.5% |
| East South Central | 63% |
| West South Central | 51.8% |
| National average | 56.1% |
The original graphic attributes its data to FHFA and shows a 56.1% national change. The Mountain division’s 66.9% covers a broad region; it is not a Telluride, San Miguel County or individual-home result.
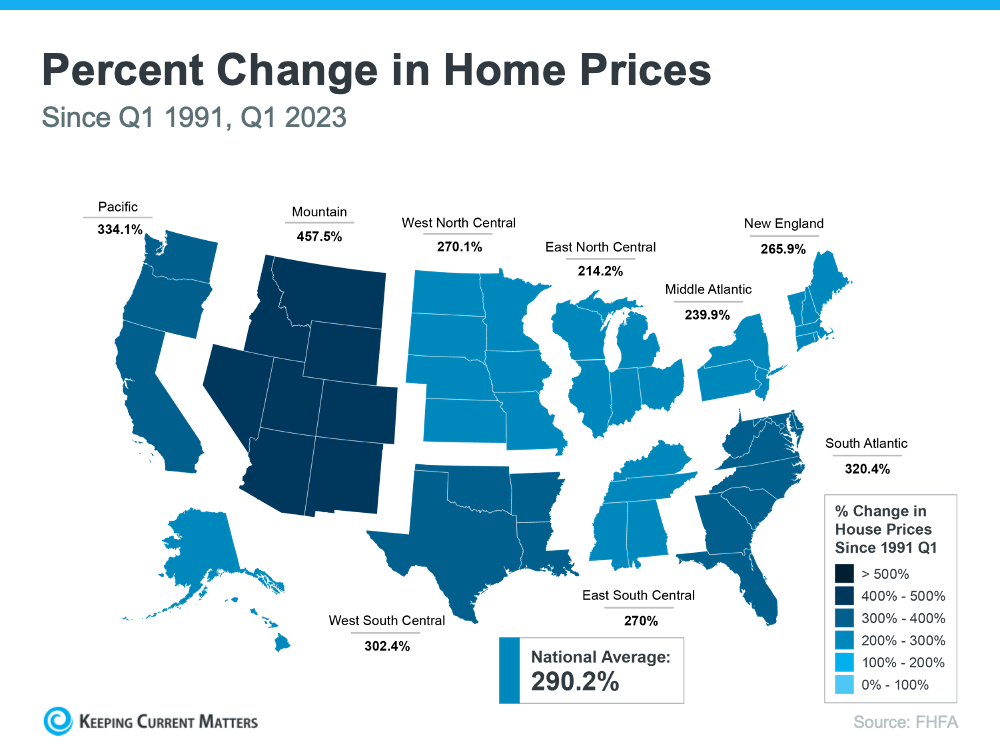
| Region | Q1 1991 to Q1 2023 change |
|---|---|
| Pacific | 334.1% |
| Mountain | 457.5% |
| West North Central | 270.1% |
| East North Central | 214.2% |
| New England | 265.9% |
| Middle Atlantic | 239.9% |
| South Atlantic | 320.4% |
| East South Central | 270% |
| West South Central | 302.4% |
| National average | 290.2% |
This is a 32-year window, rather than exactly 30 years. A 290.2% increase means adding 290.2% to the initial 100%, for an ending level of 390.2% of the starting level, or 3.902 times it. The original description of the ending value as “almost triple” was incorrect.
FHFA’s Q1 2023 report is the primary release for that period. The illustrations do not identify every index-series or calculation choice, so the transcribed figures are retained as the original charts’ values, not a newly reproduced analysis. An index is not a home appraisal or the profit on a purchase.
The original 70% figure is supported by Fannie Mae’s Q4 2022 National Housing Survey research deck: its general-population chart reports 70% viewing buying a home as a safe investment. The homeowner and renter results differ. This is a dated survey of beliefs, not a measured probability of profit or protection against a loss.
The original article contrasted fears of a late-2022 crash with price improvement in some markets during 2023. Its graphics cannot establish what every market did or justify the prediction that most homes would rise over the following year. Local markets, property types and holding periods can have different outcomes.
Price appreciation also differs from an owner’s net return. Mortgage interest, taxes, insurance, maintenance, HOA expenses, buying and selling costs and inflation all matter. Equity depends on the home’s value and outstanding debt; it is not automatically spendable cash.
Ownership may provide stability and an opportunity to build equity. Renting can provide flexibility and a different allocation of maintenance responsibilities and financial risk. Rent increases and home-price gains are not universal annual outcomes. Compare the actual alternatives, total costs, reserves and likely time in the home.
Whether you are considering a mountain retreat, an investment property or a permanent residence, use current comparable sales and property-specific financing and use information. A long-term perspective can be useful without making immediate purchase the right choice for every household.
For a property-specific discussion in Telluride or Mountain Village, contact Anne-Britt Ostlund at Mountain Rose Realty.