

October 2023 archive: The headline preserves this article's original outlook. The national evidence below describes the period available in 2023; it cannot establish that a housing downturn is impossible or predict the value of a Telluride home.
The article compared three sources of housing supply with the conditions around the 2008 crash: homeowners selling existing homes, builders completing new homes, and distressed properties such as foreclosures or short sales. Keeping those categories separate is useful because they measure different parts of the market.
The NAR-based graphic displays months of unsold existing-home supply. Its 2008 annual value is 10.4 months, compared with a final “Now” bar of 3.3. The original linked NAR July 2023 release reports 3.3 months at that month's sales pace. Dividing 3.3 by 10.4 gives approximately 32%, or about one-third of the earlier months-of-supply figure. This does not mean that the number of listings was one-third of the 2008 count: the sales pace also changes the ratio.
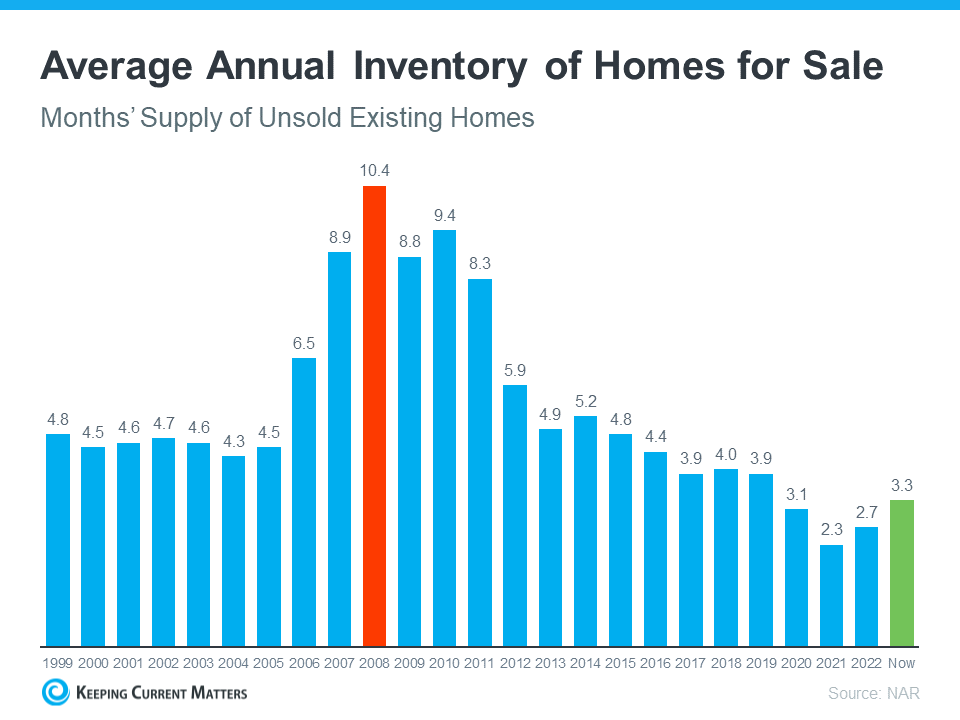
The full graphic reads: 1999, 4.8 months; 2000, 4.5; 2001, 4.6; 2002, 4.7; 2003, 4.6; 2004, 4.3; 2005, 4.5; 2006, 6.5; 2007, 8.9; 2008, 10.4; 2009, 8.8; 2010, 9.4; 2011, 8.3; 2012, 5.9; 2013, 4.9; 2014, 5.2; 2015, 4.8; 2016, 4.4; 2017, 3.9; 2018, 4.0; 2019, 3.9; 2020, 3.1; 2021, 2.3; 2022, 2.7; and the final 2023-era observation, 3.3.
Lower supply relative to sales can support seller bargaining power. Prices can nevertheless fall if demand, employment, credit availability or affordability deteriorates. There is no single inventory threshold that rules out a downturn.
The second graphic uses Census single-family housing completions and marks 14 consecutive years below its 52-year average. It preserves the original comparison, beginning in 1970 and extending into the early 2020s.
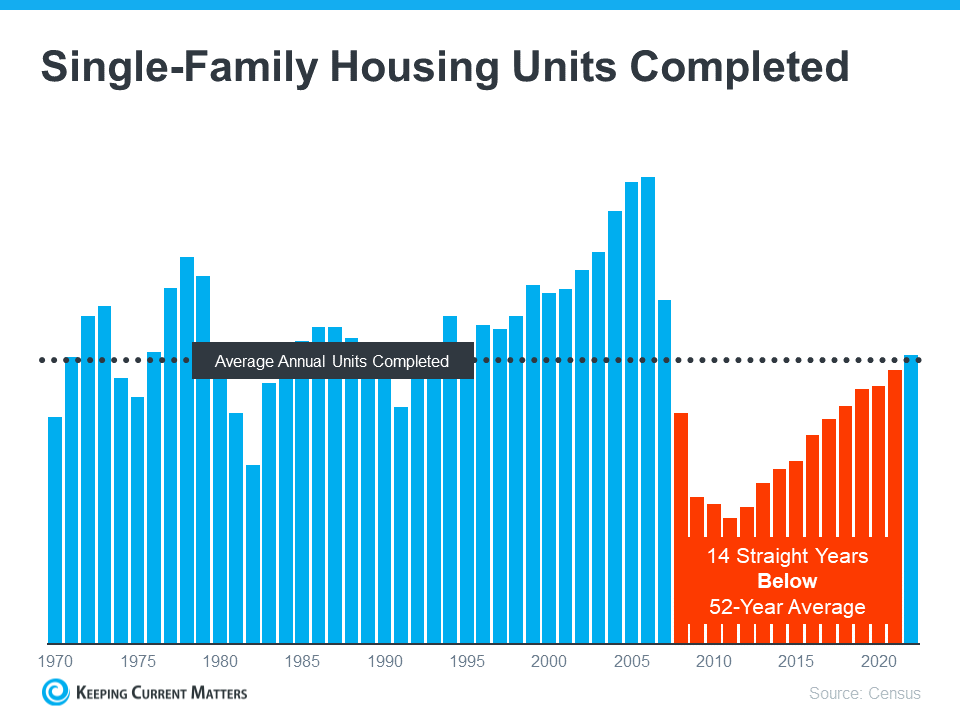
Completions count finished homes, not building permits, housing starts or the number actively listed for sale. Being below a historical average is not itself a calculation of how many homes a growing population needs. Household formation, replacement of old housing and regional differences are also relevant. A return toward that average could add choices for buyers; the chart alone cannot prove that builders will avoid overbuilding everywhere.
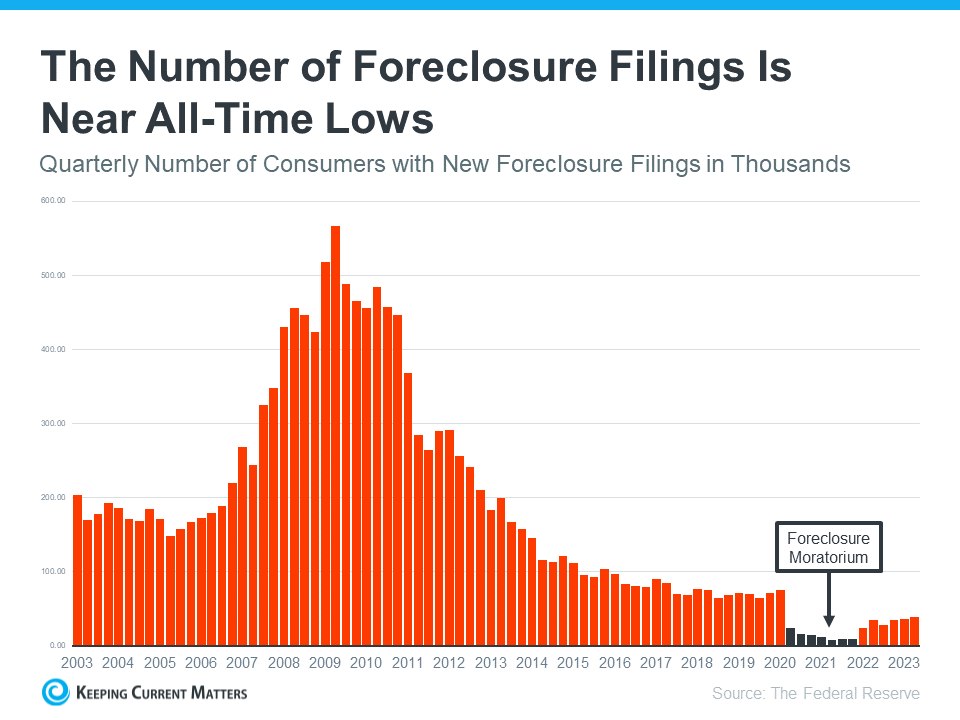
The third chart, attributed to Federal Reserve data, plots quarterly consumers with new foreclosure filings, in thousands, from 2003 through 2023. The financial-crisis peak is far higher than the final observations. Its shaded 2020–2021 period identifies the foreclosure moratorium. These are new filings, not completed foreclosures, available bank-owned listings or unique properties over the whole period.
Forbearance and subsequent repayment plans, payment deferrals and modifications gave participating borrowers ways to address missed payments. The original article's “four out of five” statement was not a guarantee against foreclosure. For a precisely scoped comparison, MBA's August 2022 workout analysis reported 82.76% making scheduled payments in its January–June 2022 post-forbearance workout performance measure. That is different from claiming every borrower leaving forbearance had paid off the loan or permanently avoided foreclosure.
The three charts help explain why the 2023 national supply picture differed from the period surrounding 2008. They do not identify local exposure, the next price cycle or the right purchase price. Review current Telluride and Mountain Village listings, closed comparables, price reductions and financing terms separately for the property type and price band involved. An attractive home and a limited market can still carry price and liquidity risk.
For a Telluride purchase or sale, contact Anne-Britt Ostlund at Mountain Rose Realty to compare local properties and coordinate with your lender.