

May 2023 market archive. These four original graphics compared national housing conditions with the financial crisis. They are useful for asking how credit, jobs, supply and equity differ across periods. They do not establish that a housing crash cannot happen or that a Telluride purchase will retain its value.
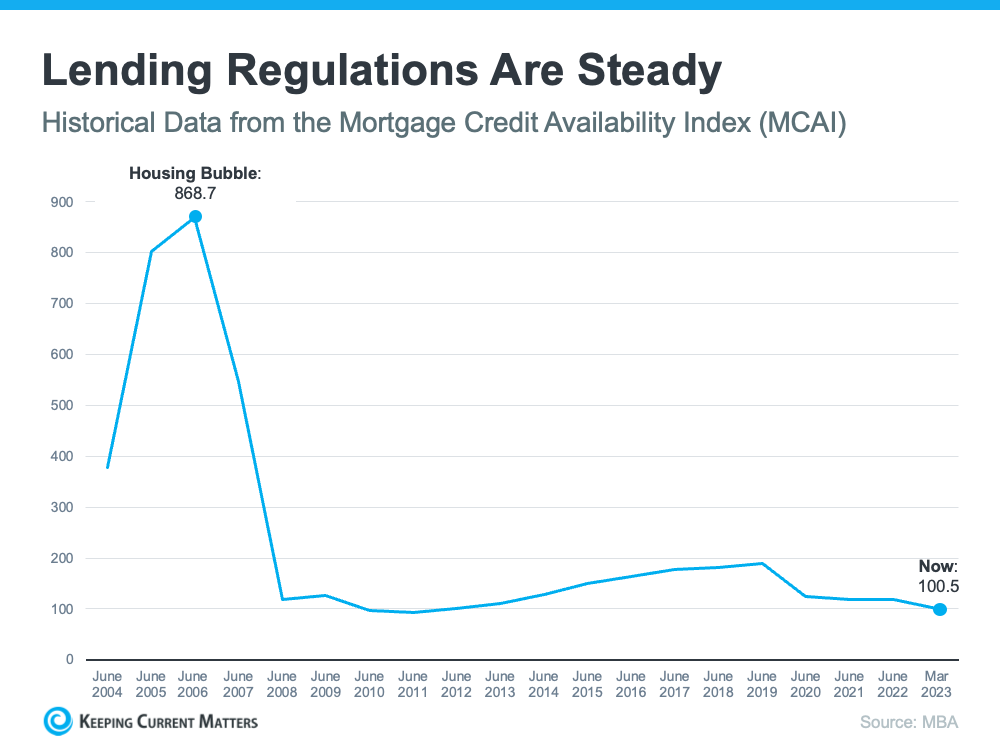
The graphic labels the Mortgage Credit Availability Index at 868.7 near the housing-bubble period and 100.5 in March 2023. MBA's April 11, 2023 release confirms the March reading of 100.5. A lower index indicates tighter available credit under MBA's method. The values are index points, not percentages of applicants approved or a direct measurement of laws and regulations.
Different underwriting conditions can change risk without eliminating it. An individual borrower still needs a lender's review of income, assets, debts, property and loan terms.
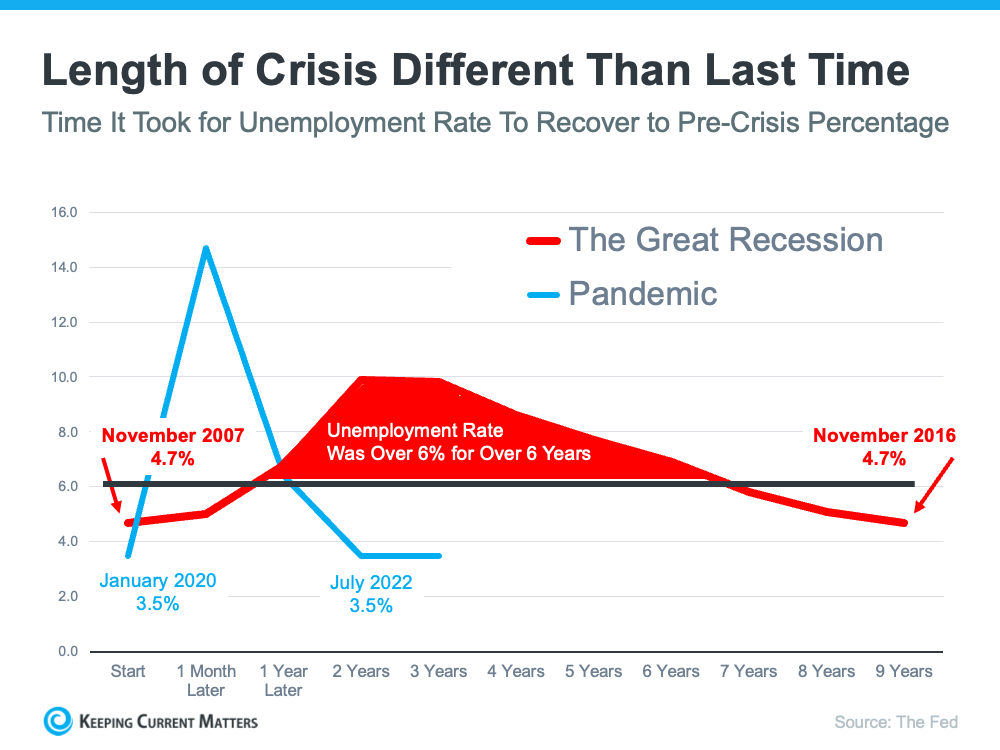
The retained illustration compares the Great Recession and pandemic using different starting dates. It labels November 2007 and November 2016 at 4.7%, and January 2020 and July 2022 at 3.5%. It illustrates a faster return to the starting unemployment rate in the pandemic comparison. Its horizontal labels simplify elapsed time and should not be read as a month-by-month calendar series.
The BLS unemployment series provides dated national observations. The duration of a past recovery does not determine the next one or show whether a specific buyer can sustain mortgage payments.
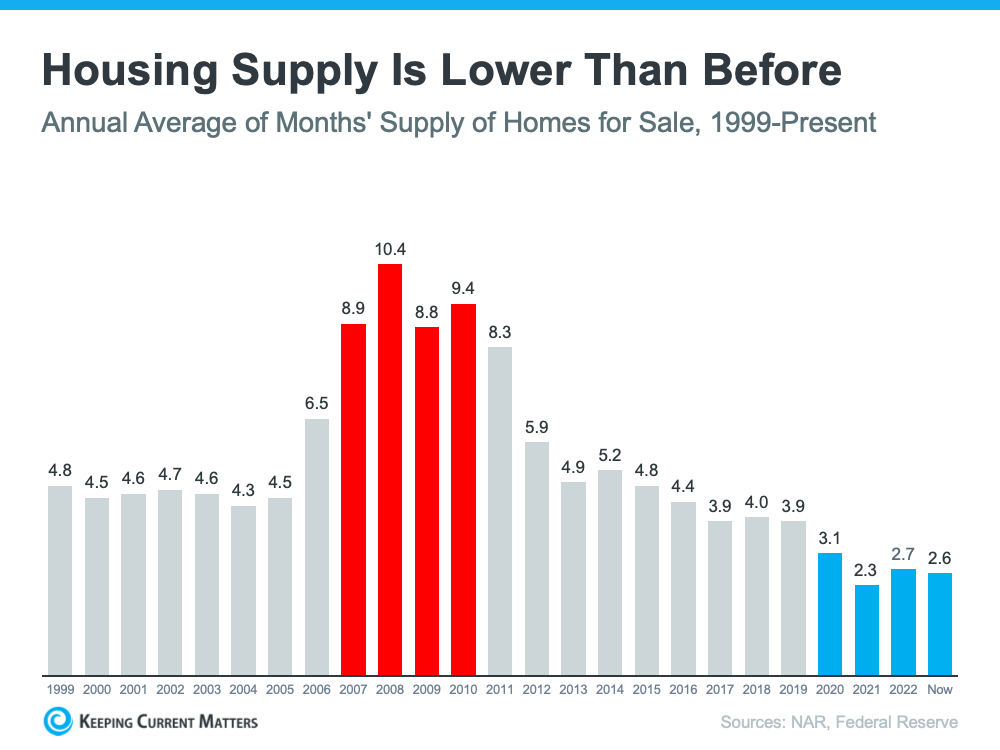
The original supply graphic shows annual averages from 1999 through 2022 and a final “Now” bar of 2.6 months associated with early 2023. Do not mistake that final monthly observation for a complete 2023 annual average. NAR's U.S. existing-home months-supply series measures how long the current inventory would take to sell at the current sales pace.
A low national reading does not describe every town, price range or type of property. Inventory and sales can both change, and limited supply does not guarantee appreciation. Use current comparable Telluride inventory and closings for a local pricing discussion.
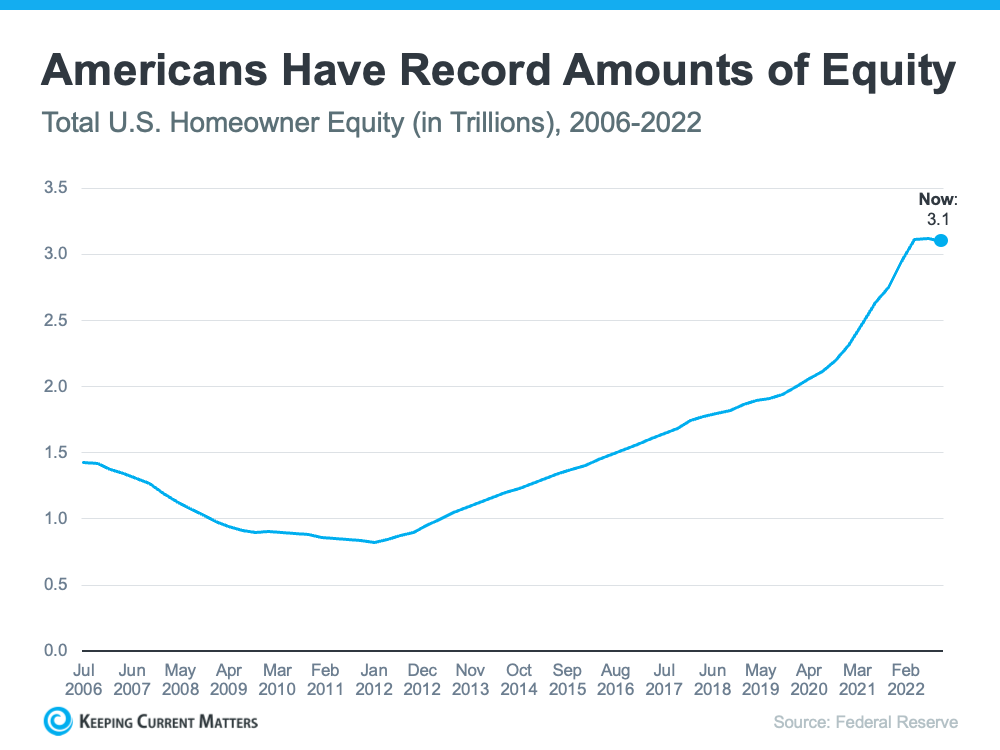
Chart limitation: the original graphic is titled total U.S. homeowner equity in trillions, but its 3.1 endpoint and plotted scale have not been reconciled to the Federal Reserve's series. Do not use that number as a verified national dollar estimate. The image remains as the original illustration, with this correction alongside it.
The Federal Reserve series measures aggregate household and nonprofit owners' equity in real estate and publishes values in millions of dollars. Aggregate equity is not evenly distributed among households. It does not establish an owner's net sale proceeds, borrowing eligibility or ability to avoid foreclosure.
These are dated national measures with different definitions and periods. Taken together, they describe aspects of the earlier market; they do not produce a dependable crash forecast. Compare a property's current value, debt, repairs, carrying costs and the owner's time horizon before deciding to buy or sell. Avoid treating a chart's reassuring headline as a guarantee.
For a property-specific discussion, contact Anne-Britt Ostlund at Mountain Rose Realty. Bring your timing, financing assumptions and comparable-property questions.