

Presented by Mountain Rose Realty and Anne-Britt Ostlund. The February 2026 edition reports January 2026 activity, compared with January 2025. The full report includes Telluride and other U.S. and Canadian markets and displays 22 pages. This page covers the North American overview, not a current Telluride market forecast.
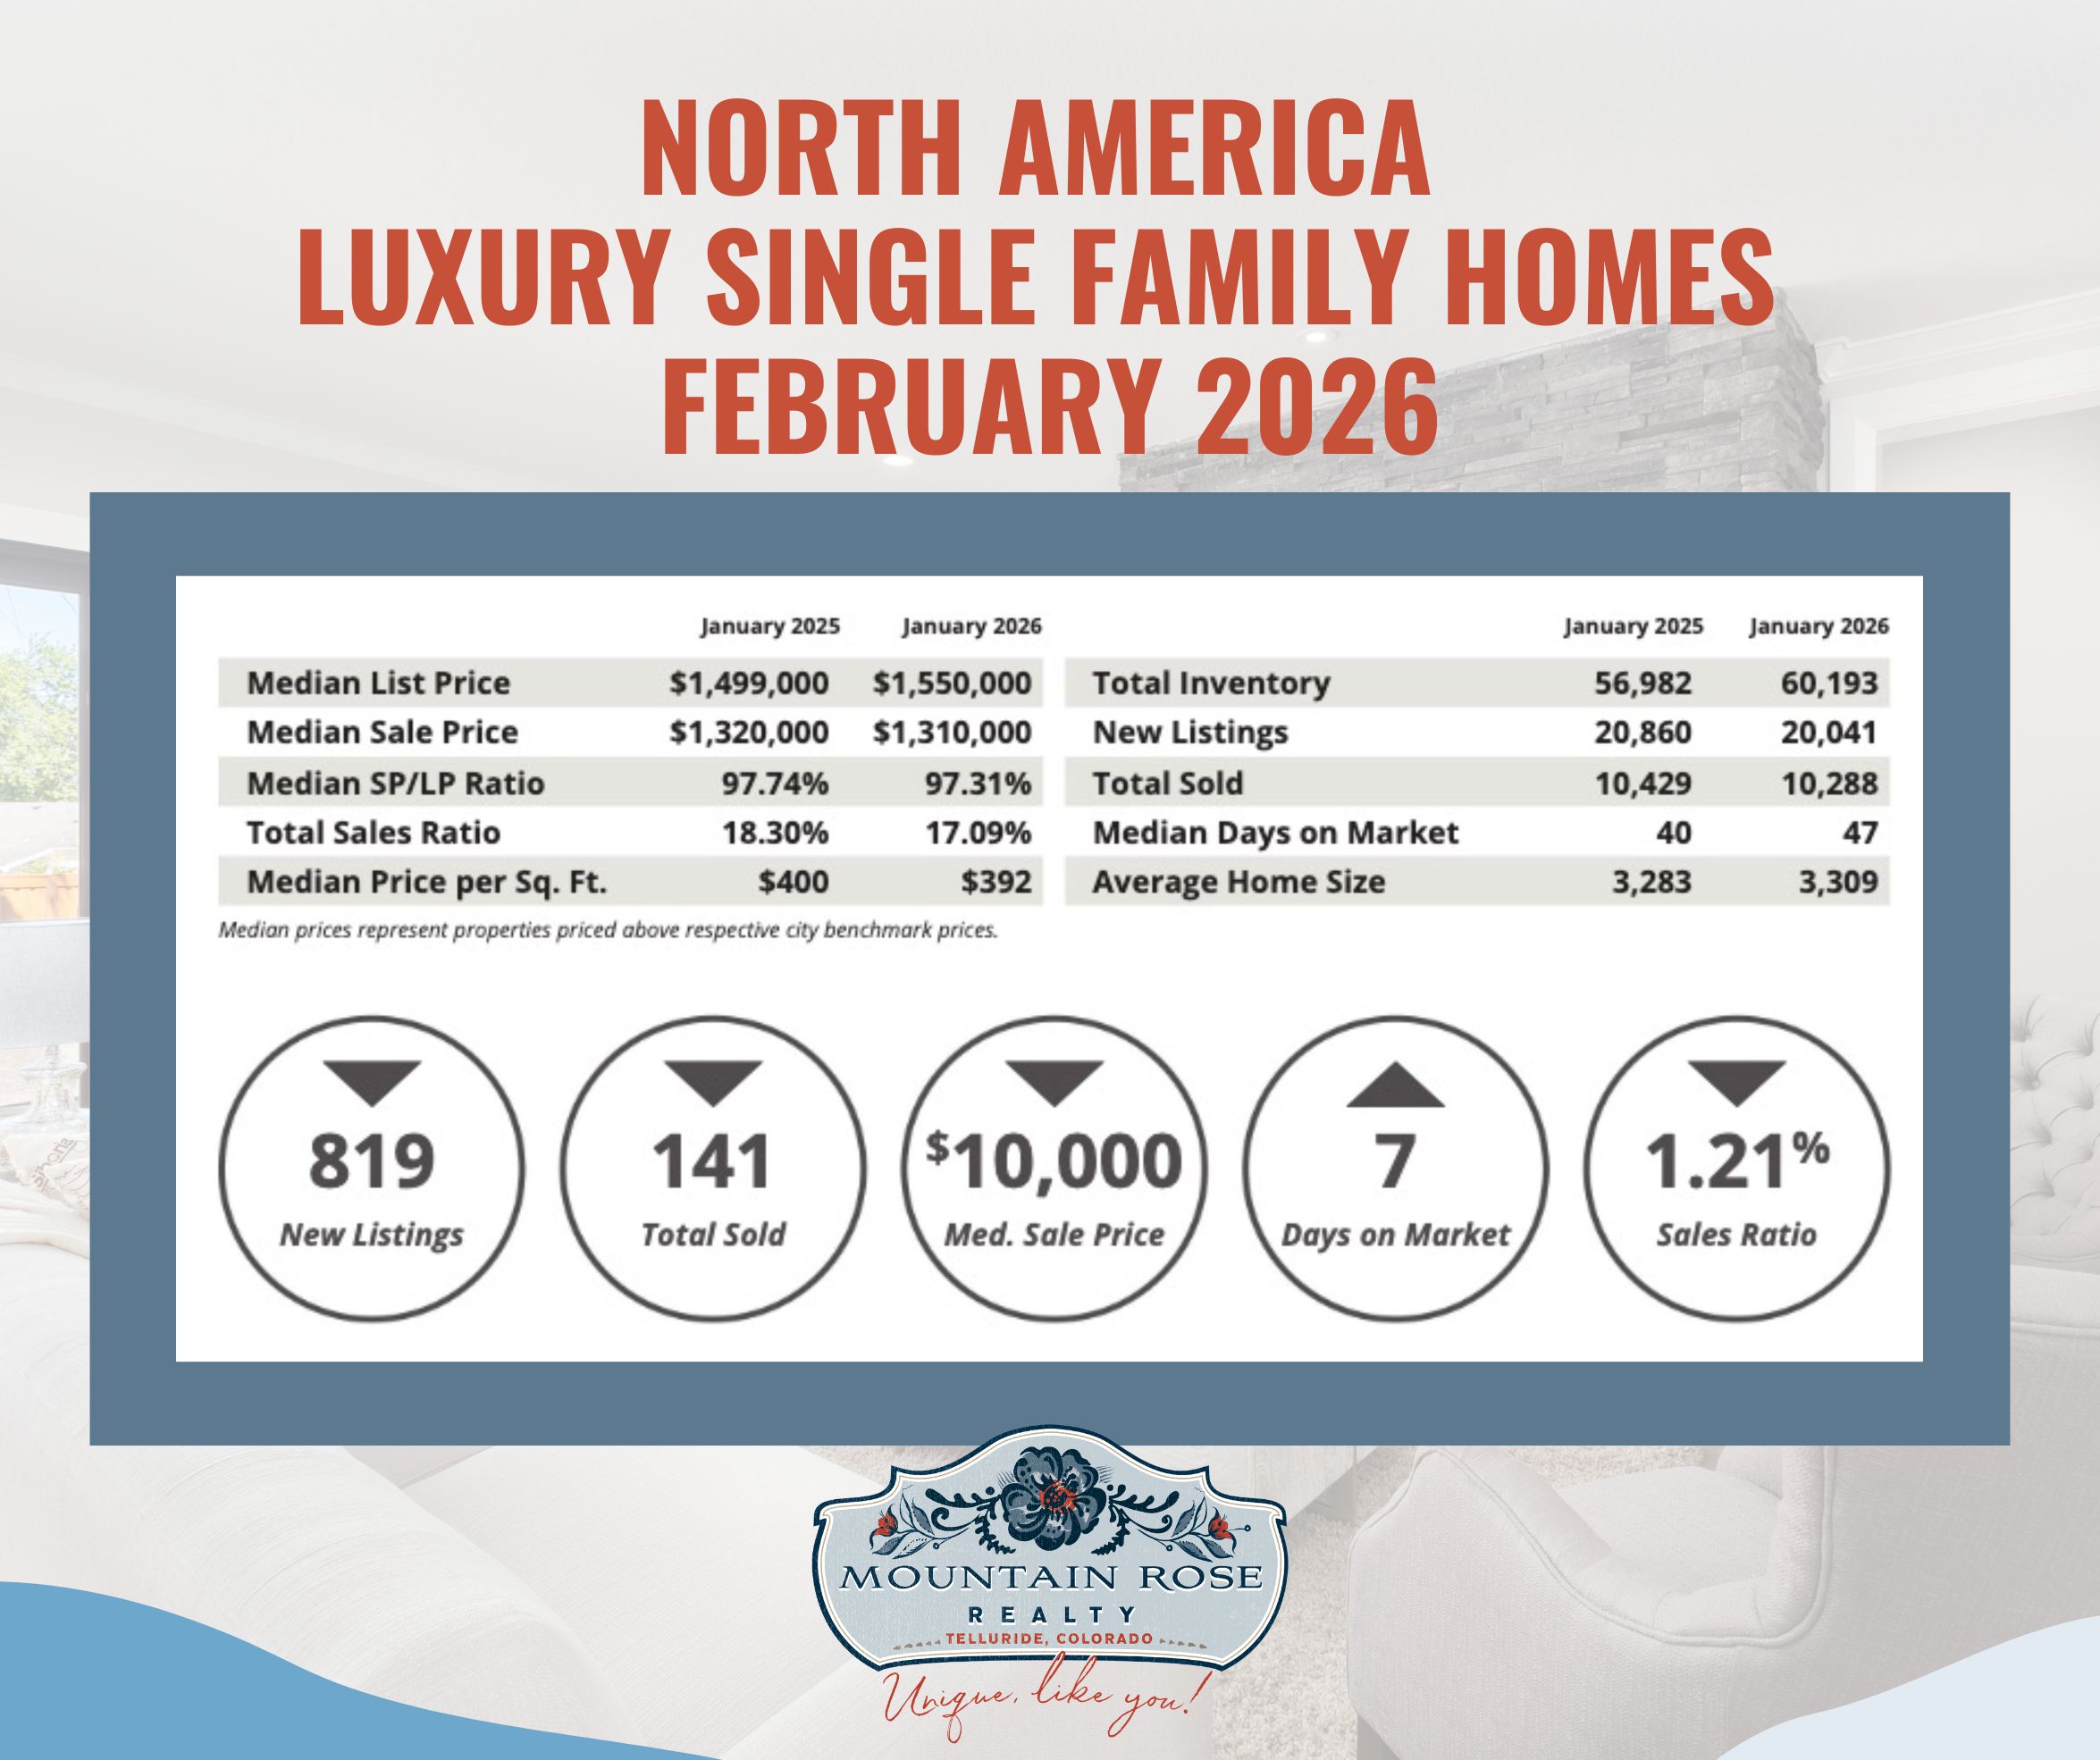
| Measure | Jan. 2025 | Jan. 2026 |
|---|---|---|
| Median list price | $1,499,000 | $1,550,000 |
| Median sale price | $1,320,000 | $1,310,000 |
| Median sale-to-list ratio | 97.74% | 97.31% |
| Total sales ratio | 18.30% | 17.09% |
| Median price per sq. ft. | $400 | $392 |
| Total inventory | 56,982 | 60,193 |
| New listings | 20,860 | 20,041 |
| Total sold | 10,429 | 10,288 |
| Median days on market | 40 | 47 |
| Average home size (sq. ft.) | 3,283 | 3,309 |
The publisher classifies the 17.09% sales ratio as balanced. Compared with January 2025, the table shows 819 fewer new listings, 141 fewer sales, a $10,000 lower median sale price, seven more median days on market and a 1.21-percentage-point lower sales ratio. The median price change is about −0.76%; it does not measure the appreciation of an unchanged property sample.
The publisher’s highest single-family median-price list names Pitkin County ($12,000,000), Paradise Valley ($5,547,500), Naples ($4,472,500) and Fort Lauderdale ($3,950,000). Its highest sales-ratio list names Lake County (54.5%), Morris County (53.5%), Anne Arundel County (53.1%) and Central Connecticut (48.5%). These are separate measures: the most expensive median is not necessarily the fastest-selling market.
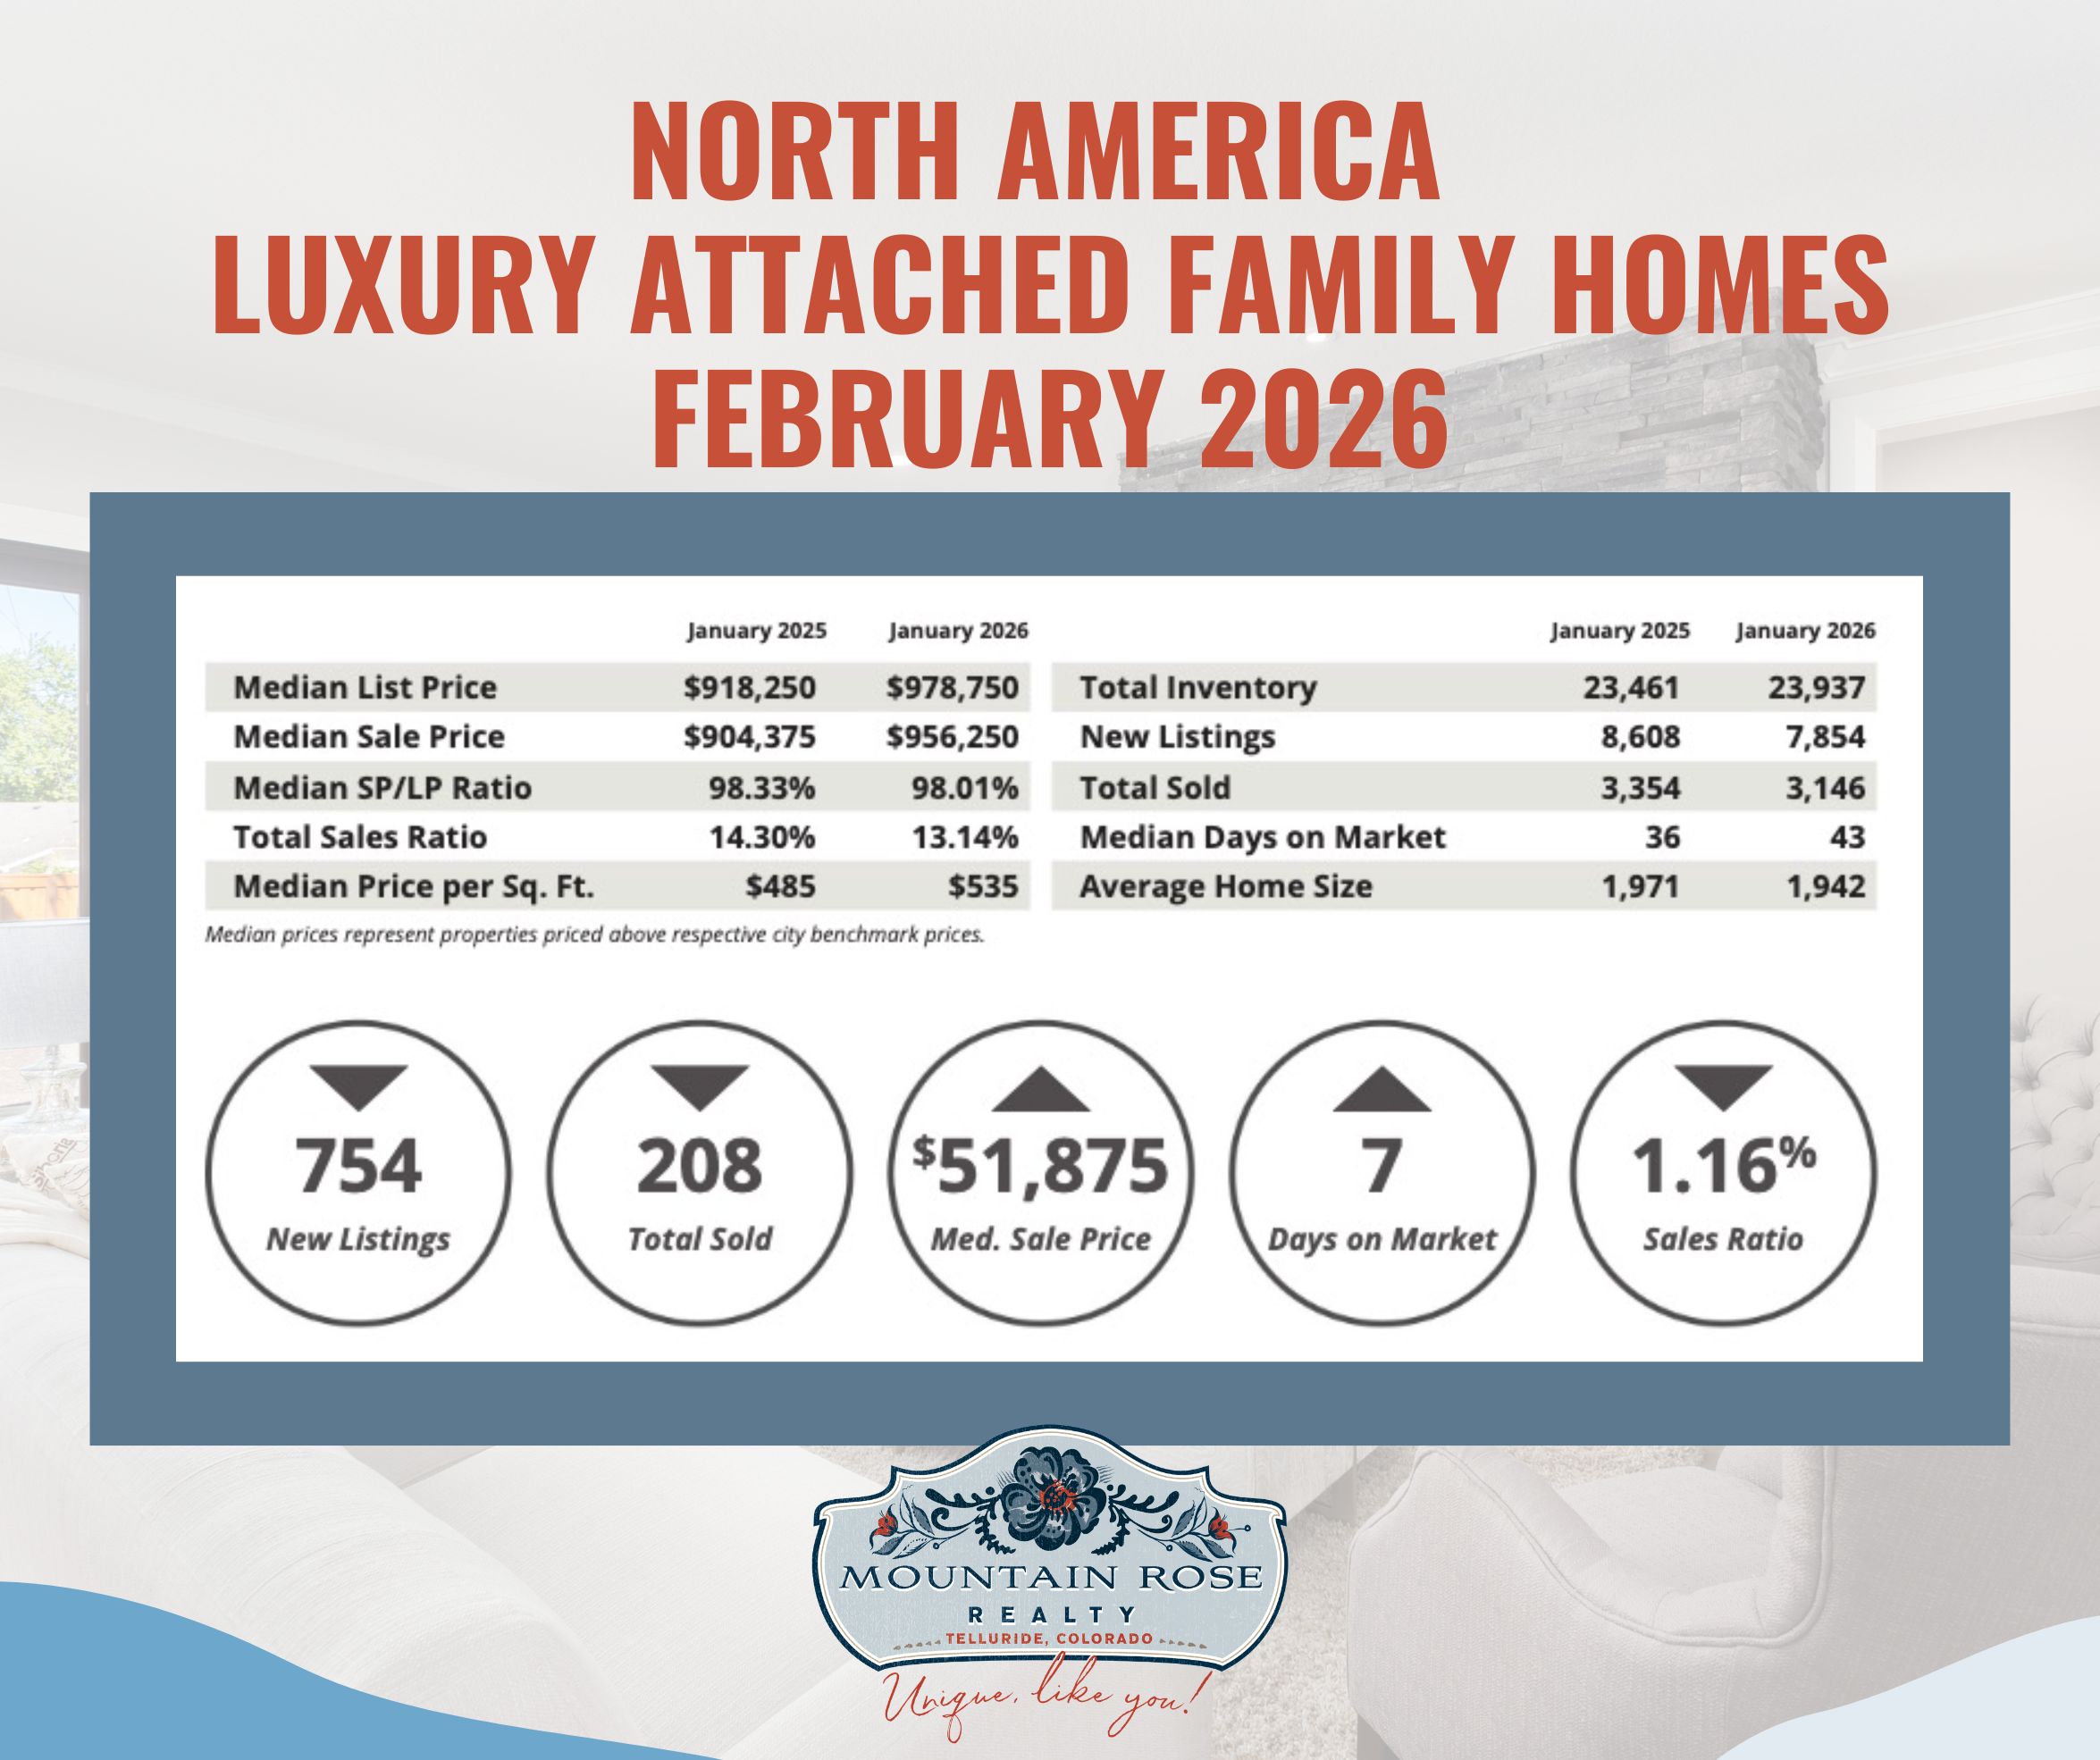
| Measure | Jan. 2025 | Jan. 2026 |
|---|---|---|
| Median list price | $918,250 | $978,750 |
| Median sale price | $904,375 | $956,250 |
| Median sale-to-list ratio | 98.33% | 98.01% |
| Total sales ratio | 14.30% | 13.14% |
| Median price per sq. ft. | $485 | $535 |
| Total inventory | 23,461 | 23,937 |
| New listings | 8,608 | 7,854 |
| Total sold | 3,354 | 3,146 |
| Median days on market | 36 | 43 |
| Average home size (sq. ft.) | 1,971 | 1,942 |
This condo and townhome category is also balanced under the publisher’s framework. It shows 754 fewer new listings, 208 fewer sales, a $51,875 higher median sale price, seven more median days on market and a 1.16-percentage-point lower sales ratio. The median sale price rose about 5.74%, while the single-family median declined slightly. It would be inaccurate to say that neither category’s median fell.
The highest attached median-price list names Pitkin County ($3,150,000), San Francisco ($3,029,000), Fort Lauderdale ($2,750,000) and Park City ($2,550,000). The highest sales-ratio list names Fairfax County (82.7%), Somerset County (58.3%), Morris County (53.8%) and Howard County (51.4%). These figures do not show that all attached homes have low upkeep, strong demand or immediate resale liquidity.
The Institute for Luxury Home Marketing sets market-specific luxury thresholds; the stated $900,000 single-family and $700,000 attached figures are median thresholds across the report, not universal entry prices or Telluride benchmarks. Its categories use sales ratios below 12% for buyer’s markets, 12% to below 21% for balanced markets, and 21% or more for seller’s markets. Those labels describe the publisher’s framework, not every property’s bargaining position.
The comparison tables label SP/LP as a median sale-to-list ratio, although the summary prose calls it an average. We use the table label. It differs from the sales ratio, which relates sales to inventory. A sales ratio can exceed 100% because the report compares period sales with inventory; it is not an individual listing’s probability of sale. Ratio changes below are percentage-point differences, not relative percentage changes.
Prices describe transactions above each city’s benchmark, not changes in value for the same homes. Canadian city prices are shown in Canadian dollars, so the publisher’s cross-market price lists are not currency-adjusted investment rankings. These North American aggregates do not establish current conditions in Telluride.
The report’s discussion of generational wealth, Baby Boomers, Gen X and Millennials provides themes to consider, not a survey demonstrating the preferences of every age group. For a multi-generational home, ask about bedroom separation, accessibility, gathering space and ongoing upkeep. A second or third home may serve a different purpose from a primary residence.
Wellness spaces, privacy, integrated technology, hybrid-work rooms and regional design can matter to a particular household. Determine which features you will use and what they cost to maintain. A turnkey home avoids some immediate work, but its condition and systems still need assessment.
Cash and private financing do not make buyers immune to rates, opportunity costs or market losses. Treat capital preservation, diversification and generational planning as objectives to assess with appropriate advisers, not returns demonstrated by a median-price chart. A scarce or attractive property can still lose value or take time to sell.
For Telluride, evaluate current matched properties, location, access, use restrictions and full ownership costs before applying these broad themes. Buyers and sellers can use the archive to organize questions while keeping current local evidence separate.
Contact Anne-Britt Ostlund at Mountain Rose Realty for a current Telluride property comparison. Her brokerage profile describes her background and services for buyers and sellers. Follow Facebook and Instagram for updates.