

Presented by Mountain Rose Realty and Anne-Britt Ostlund. This is a historical report edition covering January 2026, with January 2025 comparisons. Read the original luxury market report for its full market coverage and definitions. The edition month and the period measured are different.
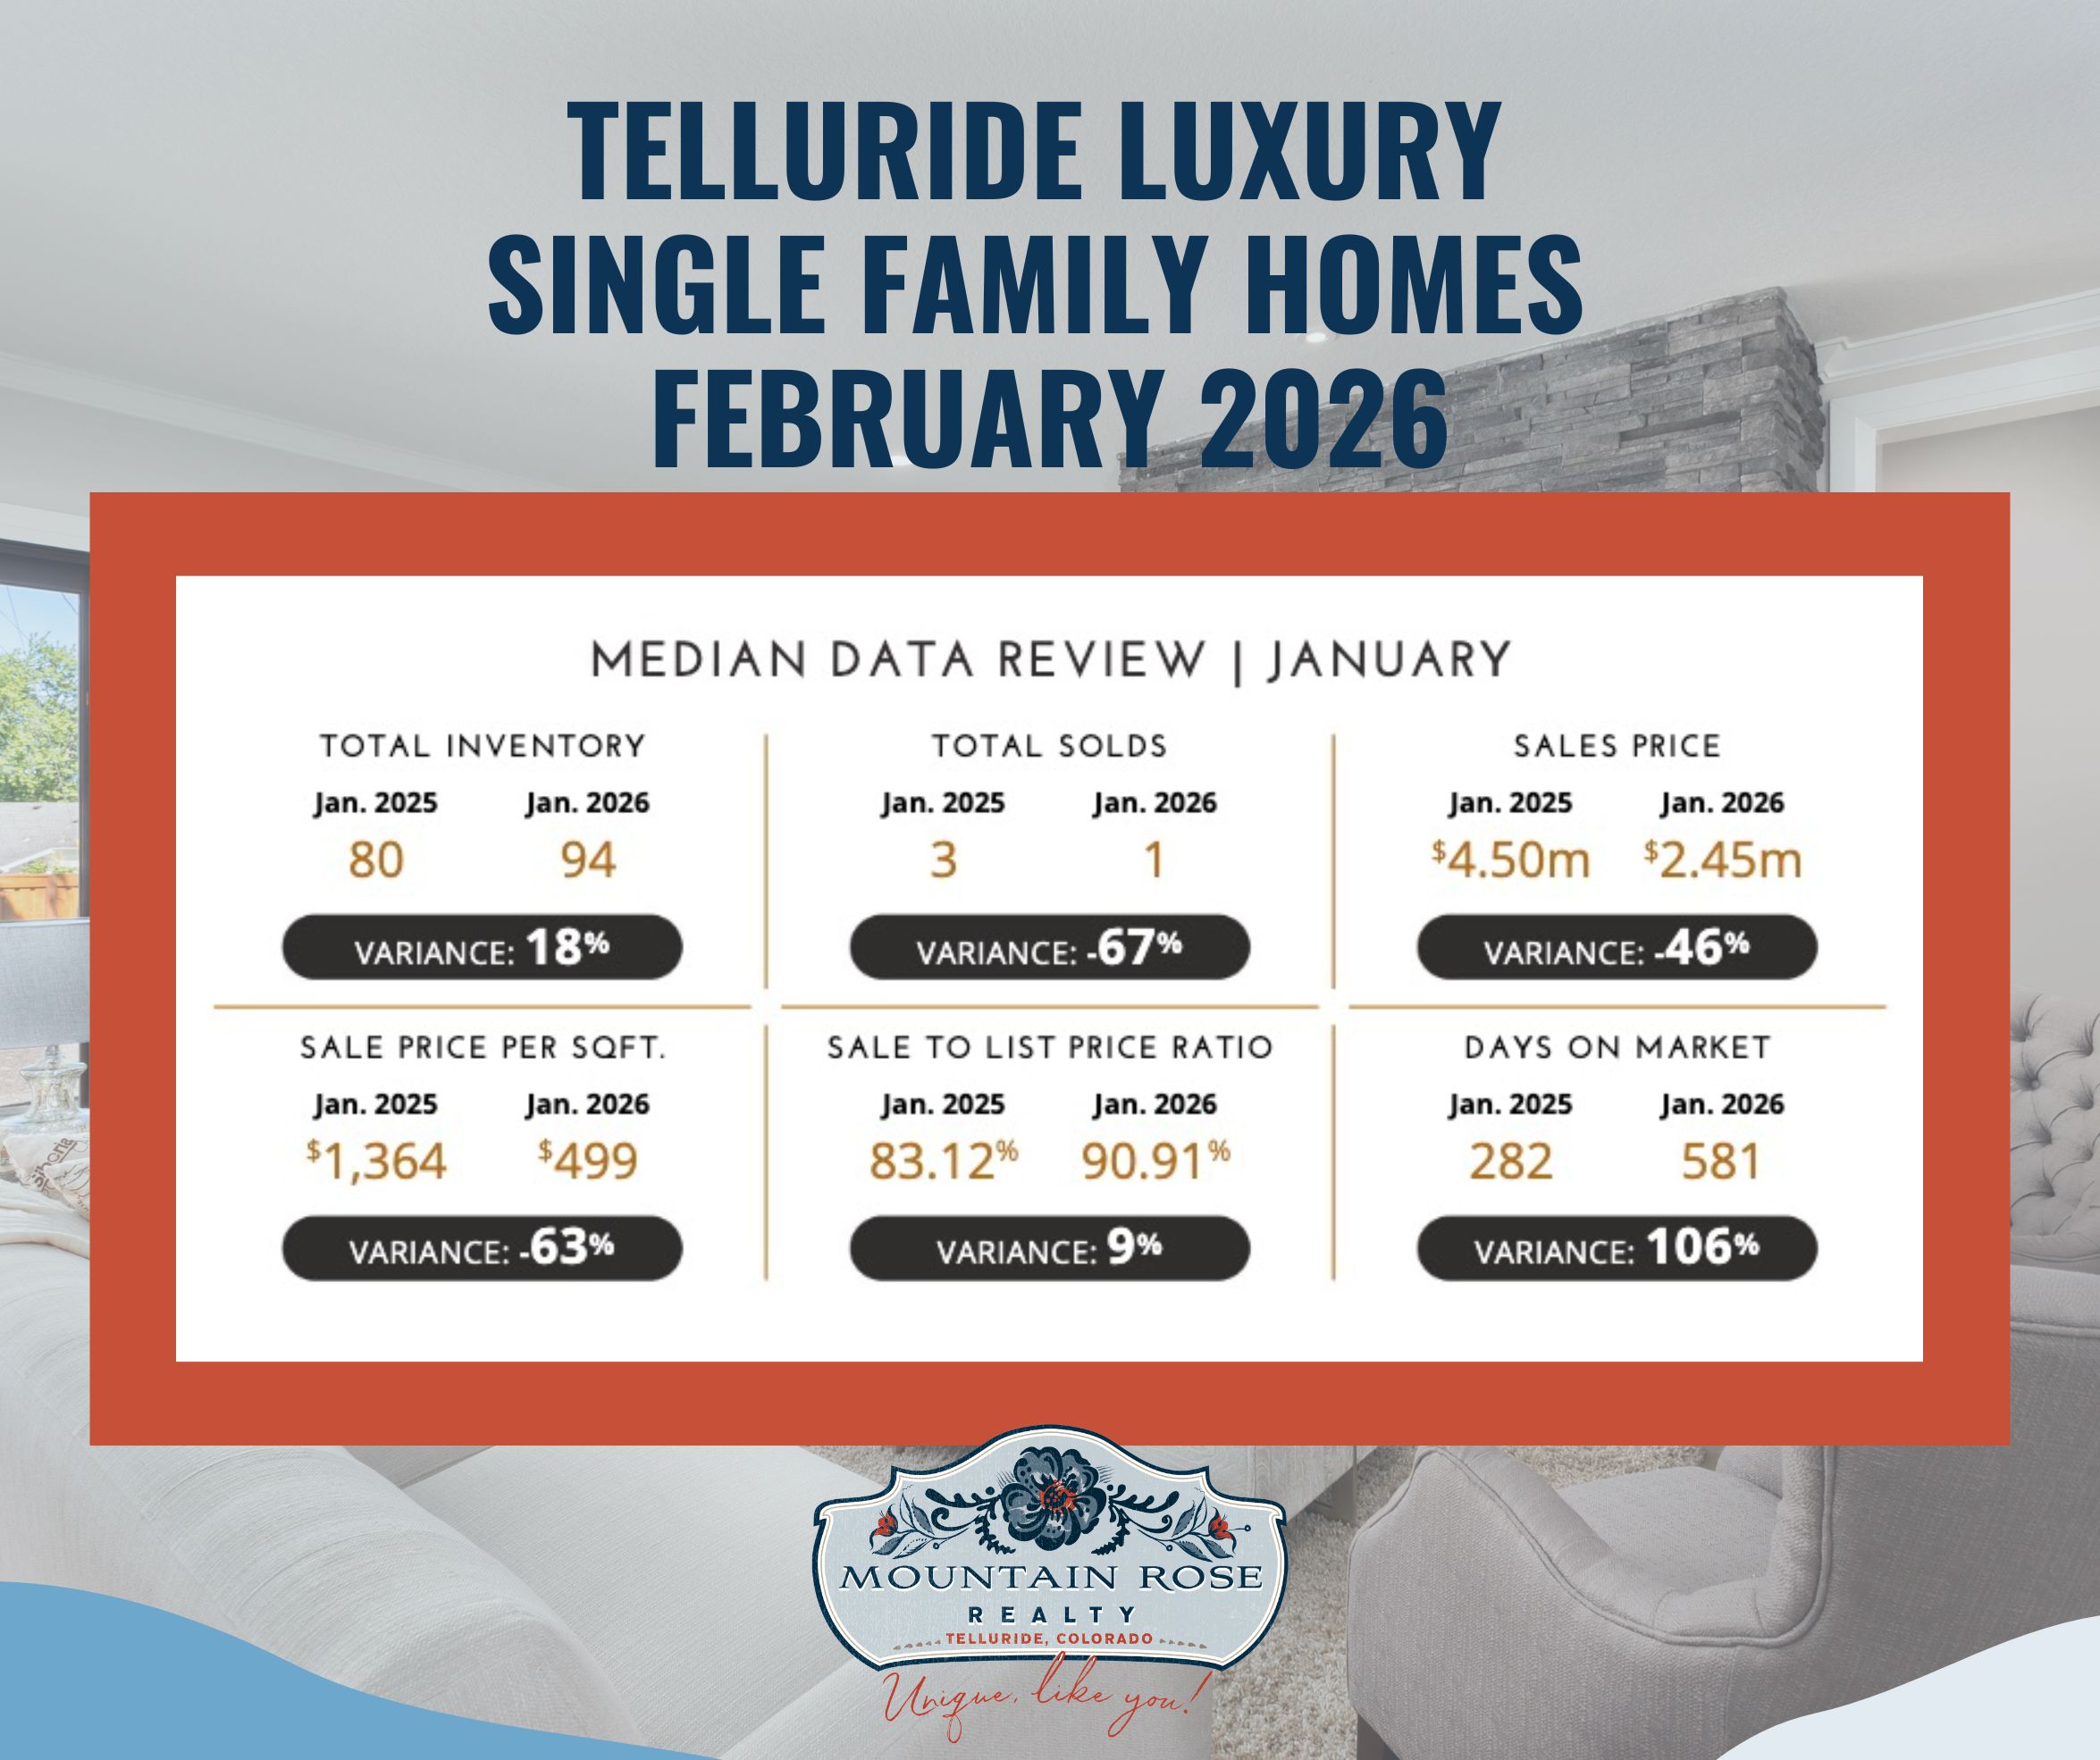
The sample size is central to interpreting this graphic: the report lists one single-family sale in January 2026, compared with three in January 2025. The $2.45 million median and 581-day median therefore describe a one-sale sample for 2026, not the expected price or marketing time of every Telluride home.
One sale divided by 94 inventory is about 1.1%, consistent with the original summary’s rounded 1% sales ratio and buyer’s-market classification. It is not a probability that any particular listing will sell. The lower median price does not mean all homes lost about 46% of their value; the properties sold in each period can be very different.
The original narrative identified $2 million to $2.5 million as its most active single-family band. The reproduced graphic does not show band-level counts, so that description should not be generalized into a broad pool of demand from this one-sale month. The graphic labels a sale-to-list ratio, without establishing that the denominator is the original asking price; the earlier original-list-price wording has been removed.
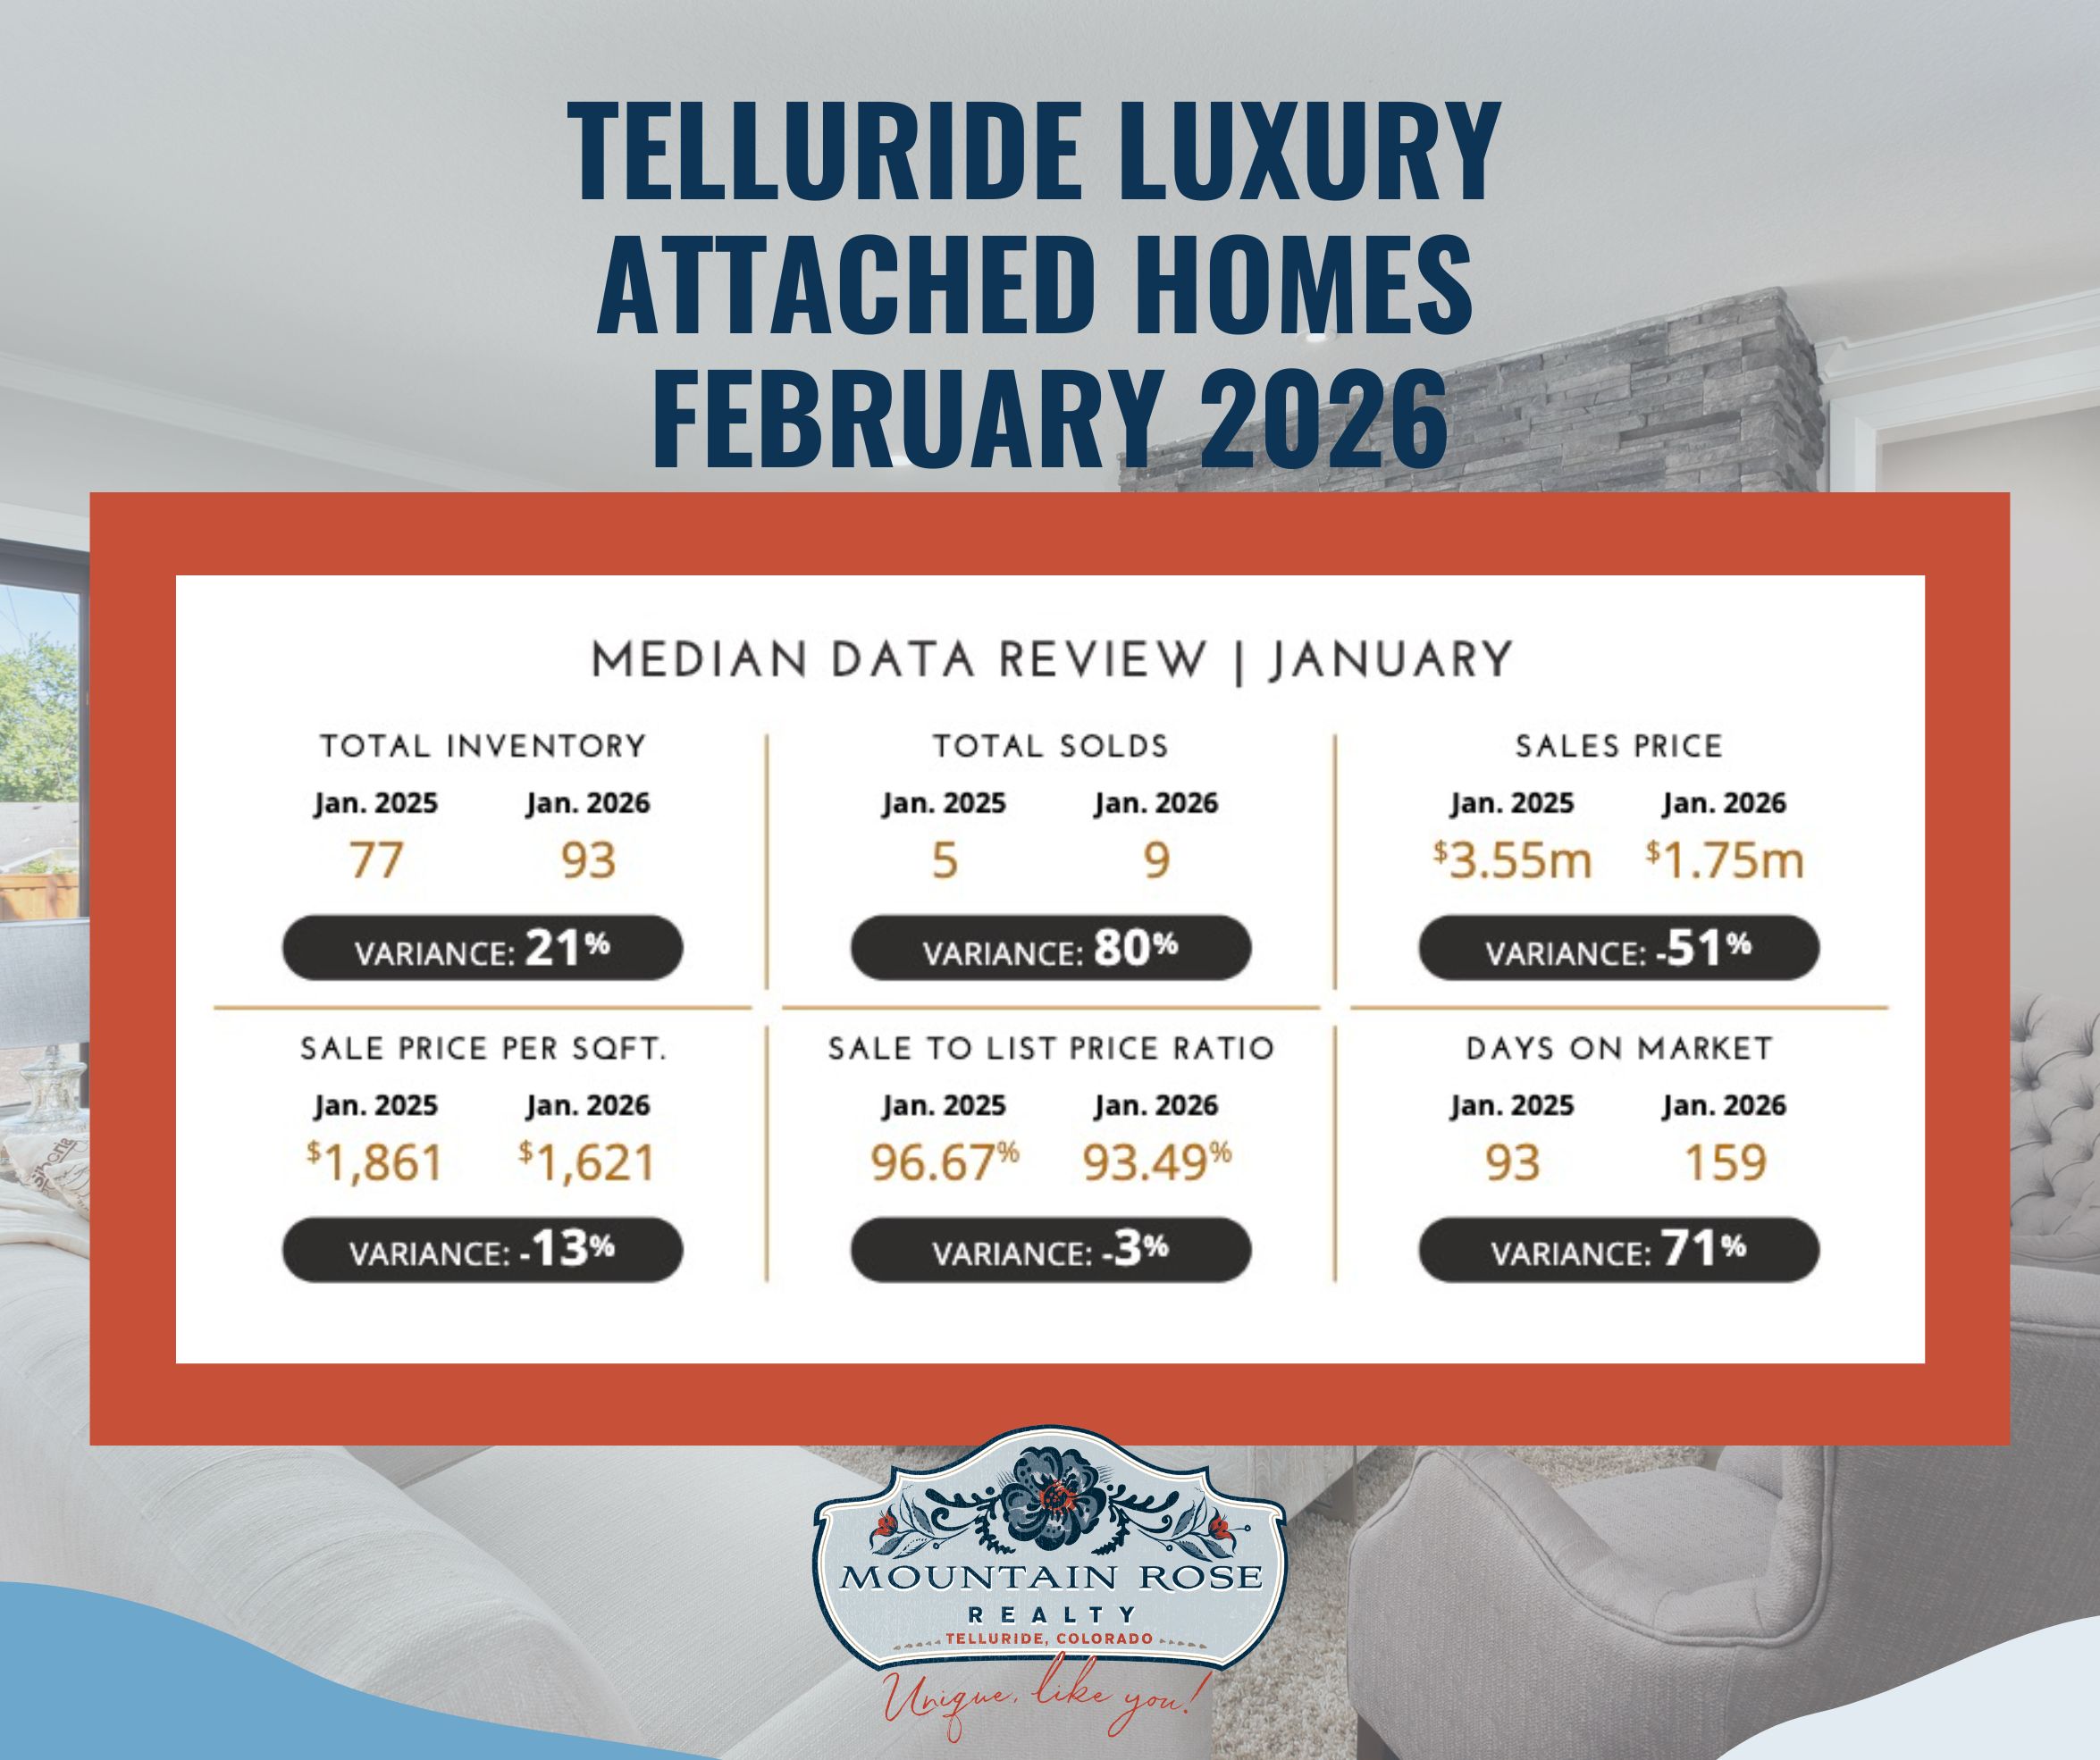
Nine divided by 93 is about 9.7%, consistent with the summary’s rounded 10% sales ratio. The original narrative gave a more precise attached median of approximately $1.748 million and identified the $1.5 million to $2 million band as most active. The graphic itself rounds the price and does not display the band-level calculation.
The year-over-year median decline and rise in days on market describe the reported transactions. They do not establish the change in value of the same properties, the preferences of all second-home owners or a guaranteed discount on a current listing.
These figures were previously described in some answers as February results. The chart labels explicitly identify January. Its prices and days on market are medians, not averages. The percentages in the graphic’s variance boxes are rounded relative changes; they should not be confused with percentage-point changes in the sale-to-list ratio.
The report’s Telluride coverage is a defined luxury segment. Without its underlying property records and geographic boundaries, do not extend it to every property in the Town of Telluride, Mountain Village or San Miguel County. The single-family count in particular makes broad claims about buyer leverage or long-term value unreliable.
The Institute for Luxury Home Marketing uses market-specific luxury thresholds and selected markets across the United States and Canada. This is not a census of every North American home. A median describes the middle of the reported observations and can change when the mix of homes sold changes; it does not measure appreciation of the same properties.
Sales ratio compares reported sales with inventory. The Institute labels ratios below 12% a buyer’s market, 12% to below 21% balanced, and 21% or more a seller’s market. A ratio over 100% can occur when sales during the reporting period exceed the inventory snapshot. It does not mean homes sell that percentage faster, and it is not a price-growth rate.
Use the Institute’s report description for source context. Its underlying data come from several sources and are not guaranteed. The figures here are reported historical statistics, not independently reconstructed MLS results.
For a purchase or sale, compare current closed transactions and competing listings in the relevant location, property type and price band. Review condition, access, parking, maintenance, association finances and any rental restrictions separately. A report’s market label does not establish the negotiating room, rental permission or future value of an individual home.
Contact Anne-Britt Ostlund at Mountain Rose Realty to discuss the property and the evidence needed for your decision.