

Presented by Mountain Rose Realty and Anne-Britt Ostlund. This is a historical report edition covering October 2025, with October 2024 comparisons. Read the original luxury market report for its full market coverage and definitions. The edition month and the period measured are different.
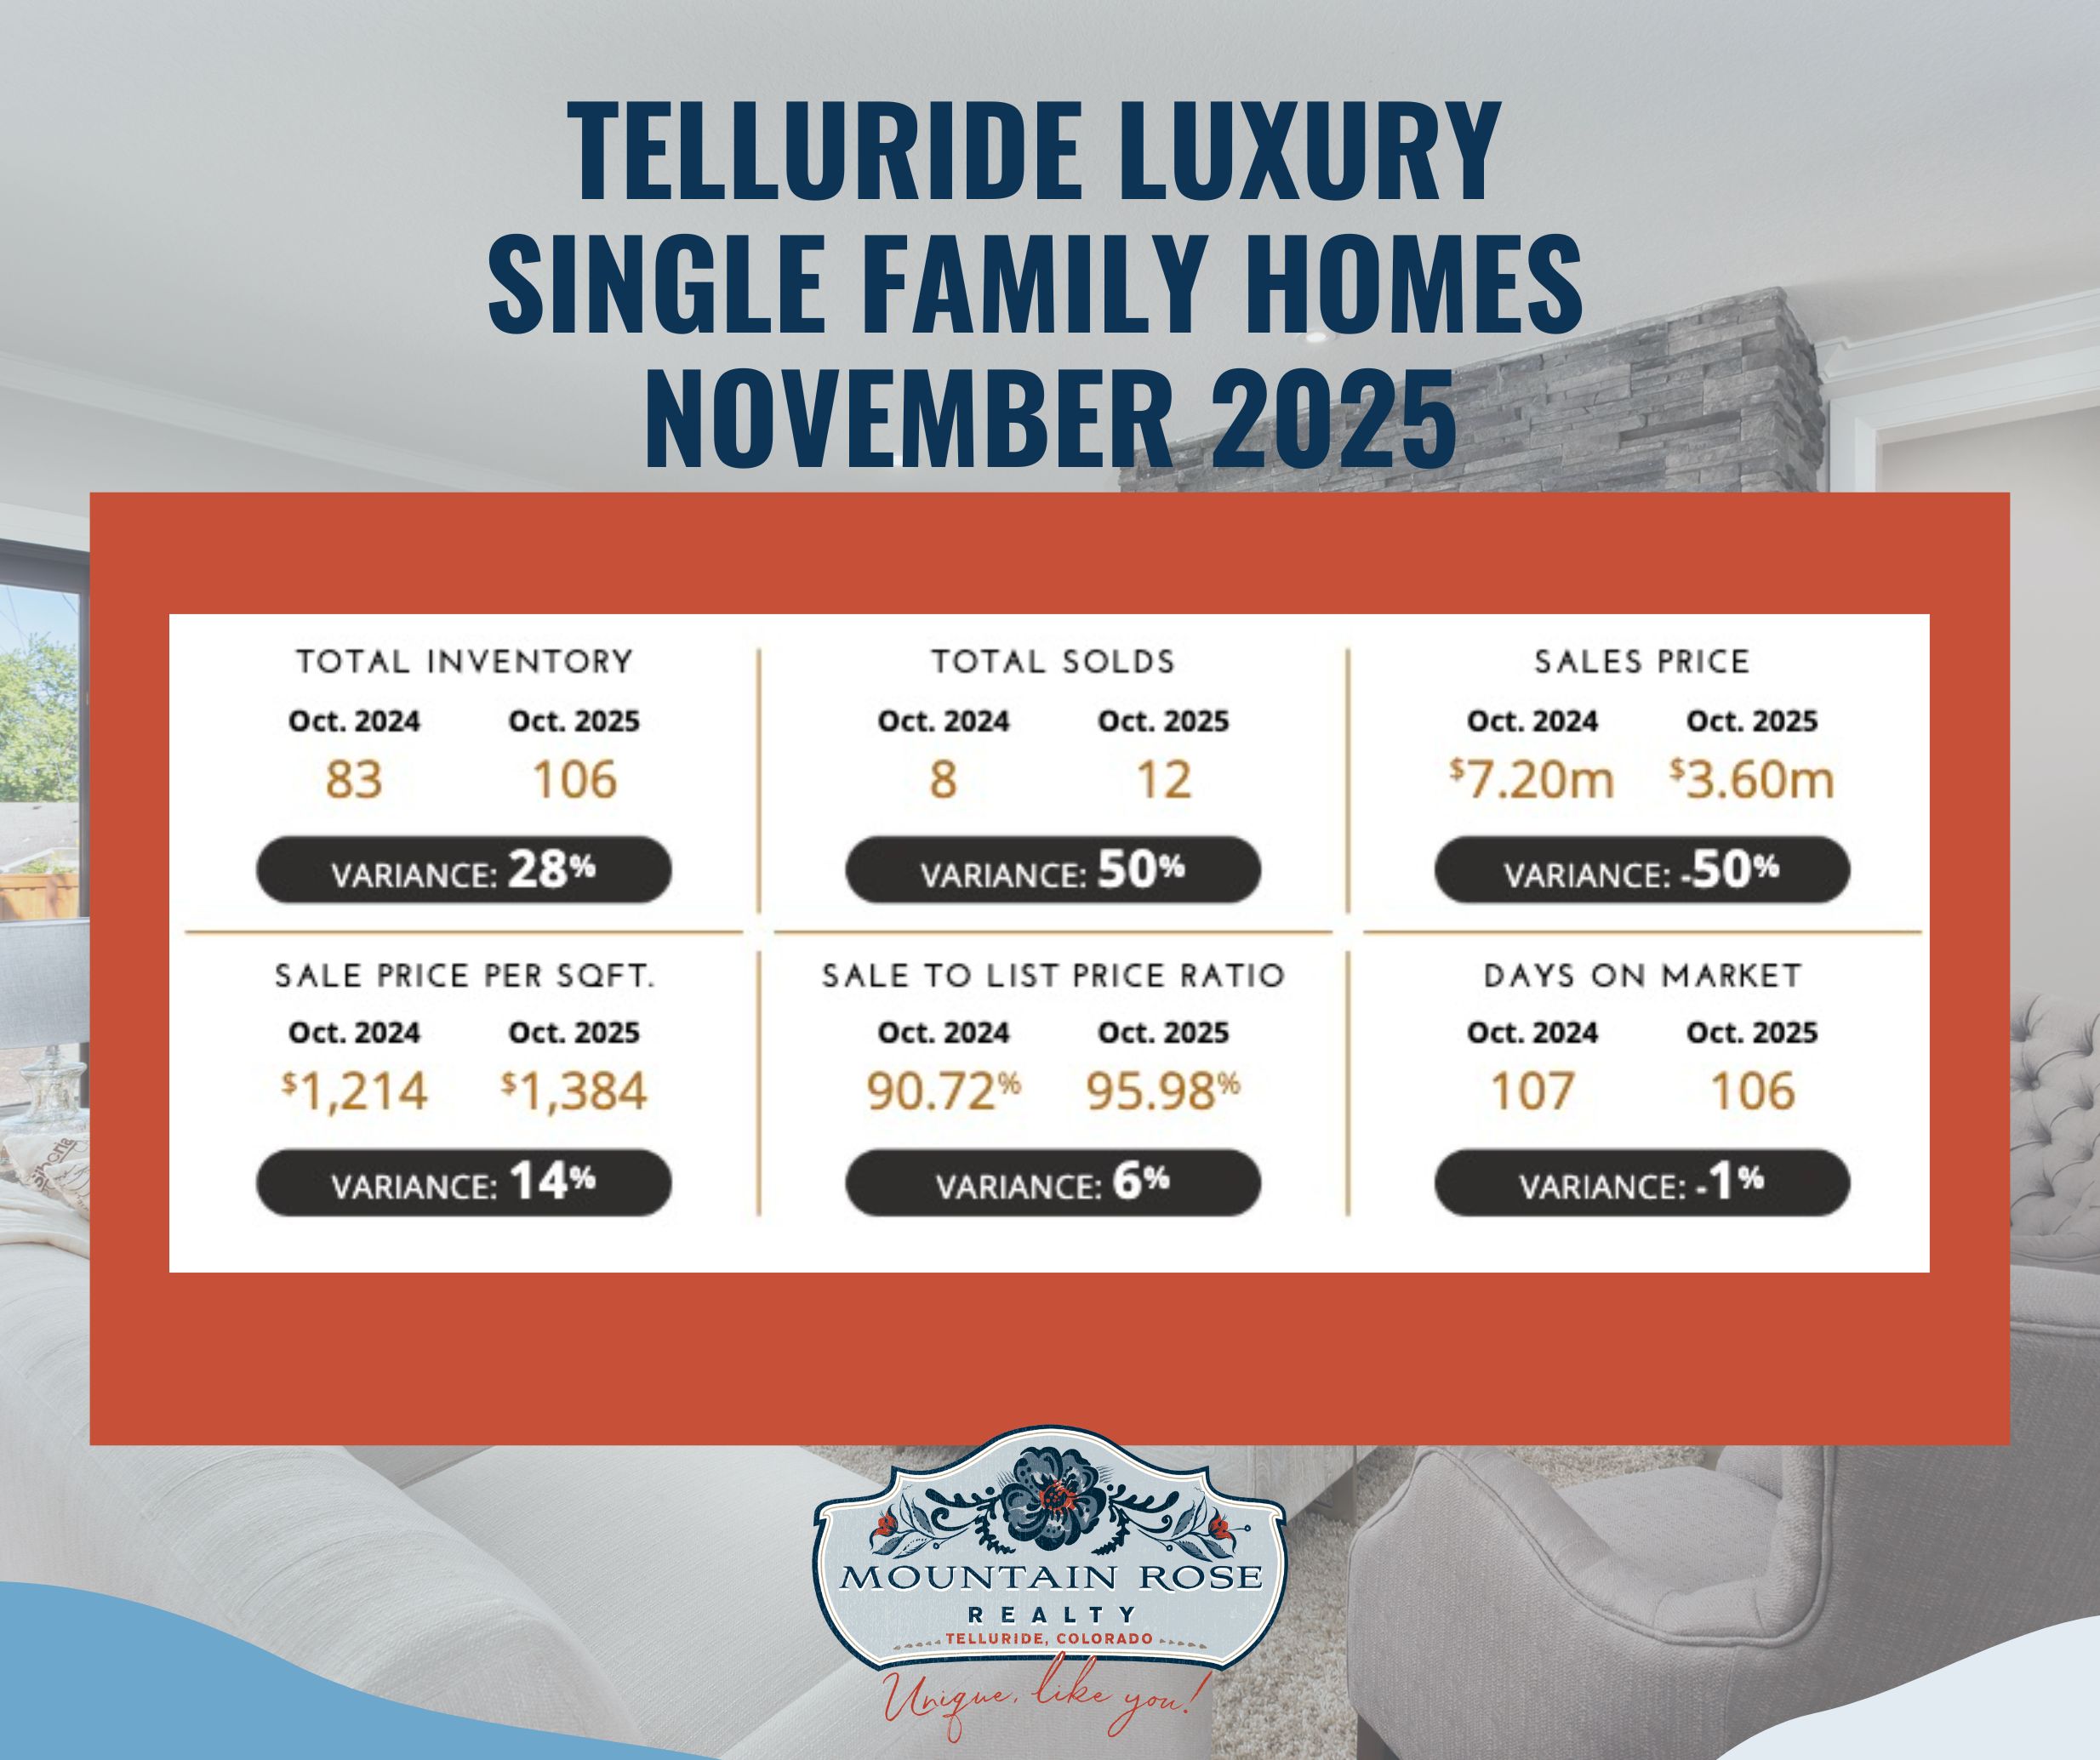
Twelve sales divided by 106 inventory is about 11.3%, consistent with the original summary’s rounded 11% sales ratio and buyer’s-market label. The original summary identified the $2,000,000–$2,499,999 band with a 67% sales ratio. That band-level result is distinct from the overall ratio; the reproduced chart does not supply its sales and inventory counts.
The median sale price was half the prior-year median while the median price per square foot rose. Those different measures underscore why transaction mix matters. The table does not show that every home lost half its value, nor does it support a claim that long-term values rarely decline.
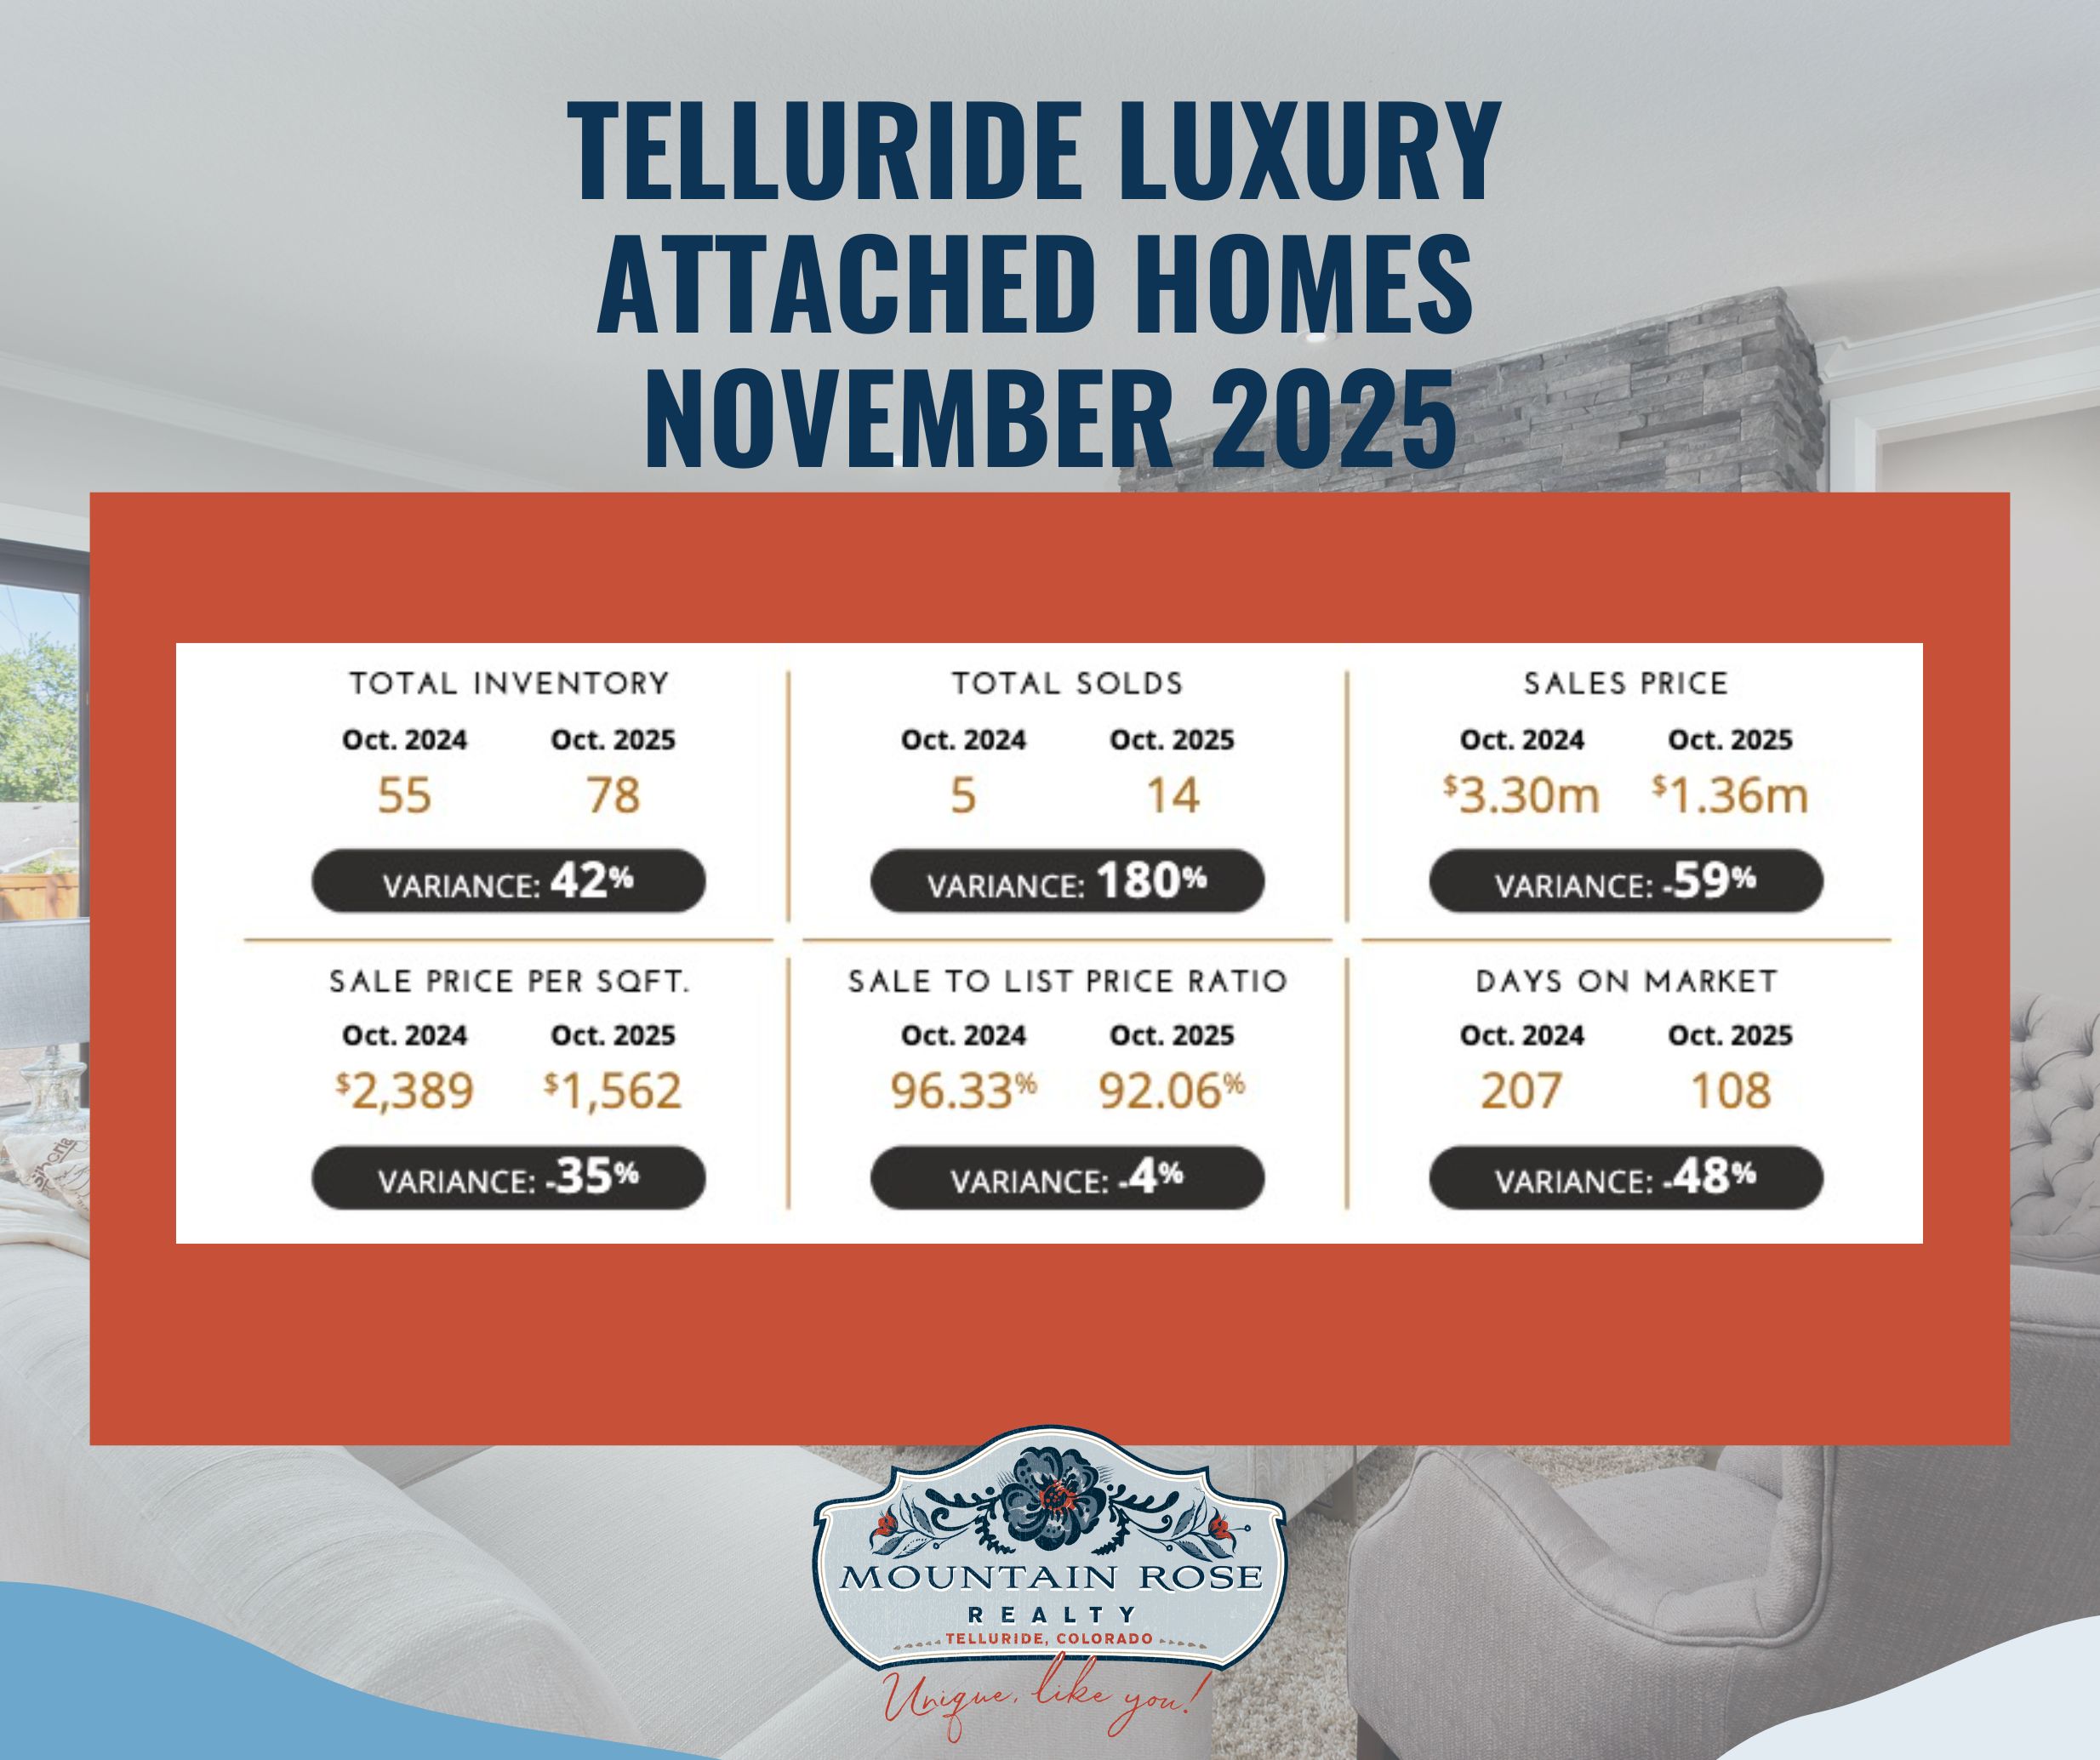
The original summary gave the attached median as $1,362,500; the graphic rounds it. Fourteen sales divided by 78 inventory is about 17.9%, consistent with the rounded 18% balanced-market label. A lower median and shorter days on market can occur together when different properties sell.
The original summary described the $900,000–$999,999 attached band with a 150% sales ratio. The band’s exact counts are not shown in this reproduced graphic. Under the report’s sales-to-inventory convention, a ratio above 100% means period sales exceed the inventory snapshot. It does not mean homes sold 150% faster, prices rose 150%, or inventory replenishment was measured at that rate.
A small band can produce a high ratio with very few transactions. Review the underlying counts and the properties involved before using it as evidence for an offer or asking price.
The two graphics describe the report’s Telluride luxury coverage for one month. They do not establish every buyer’s motivations, current rental eligibility, future appreciation or that Telluride outperforms other markets. A condo’s maintenance responsibilities, association expenses, rental rules and location need separate review; attached ownership is not automatically simple or income-producing.
The tables’ sale-to-list measures are medians. They cannot establish that each seller priced realistically or that a current buyer should receive a particular concession. Ask for current comparable sales and a clear explanation of the report’s geographic boundaries before treating the historical labels as today’s negotiating conditions.
The Institute for Luxury Home Marketing uses market-specific luxury thresholds and selected markets across the United States and Canada. This is not a census of every North American home. A median describes the middle of the reported observations and can change when the mix of homes sold changes; it does not measure appreciation of the same properties.
Sales ratio compares reported sales with inventory. The Institute labels ratios below 12% a buyer’s market, 12% to below 21% balanced, and 21% or more a seller’s market. A ratio over 100% can occur when sales during the reporting period exceed the inventory snapshot. It does not mean homes sell that percentage faster, and it is not a price-growth rate.
Use the Institute’s report description for source context. Its underlying data come from several sources and are not guaranteed. The figures here are reported historical statistics, not independently reconstructed MLS results.
For a purchase or sale, compare current closed transactions and competing listings in the relevant location, property type and price band. Review condition, access, parking, maintenance, association finances and any rental restrictions separately. A report’s market label does not establish the negotiating room, rental permission or future value of an individual home.
Contact Anne-Britt Ostlund at Mountain Rose Realty to discuss the property and the evidence needed for your decision.